

My free interactive Range Analysis indicator is now live and it can be a game changer for your trading.
• Auto Range levels
• Volume & Open Interest profile
• Volume & OI heatmap
• Anchored VWAP
• much more
Retweets are very appreciated!
1/5
• Auto Range levels
• Volume & Open Interest profile
• Volume & OI heatmap
• Anchored VWAP
• much more
Retweets are very appreciated!
1/5
How to get and use the script?
1. Visit this link, click “Add to my favorite indicators” and add it to your chart - tradingview.com
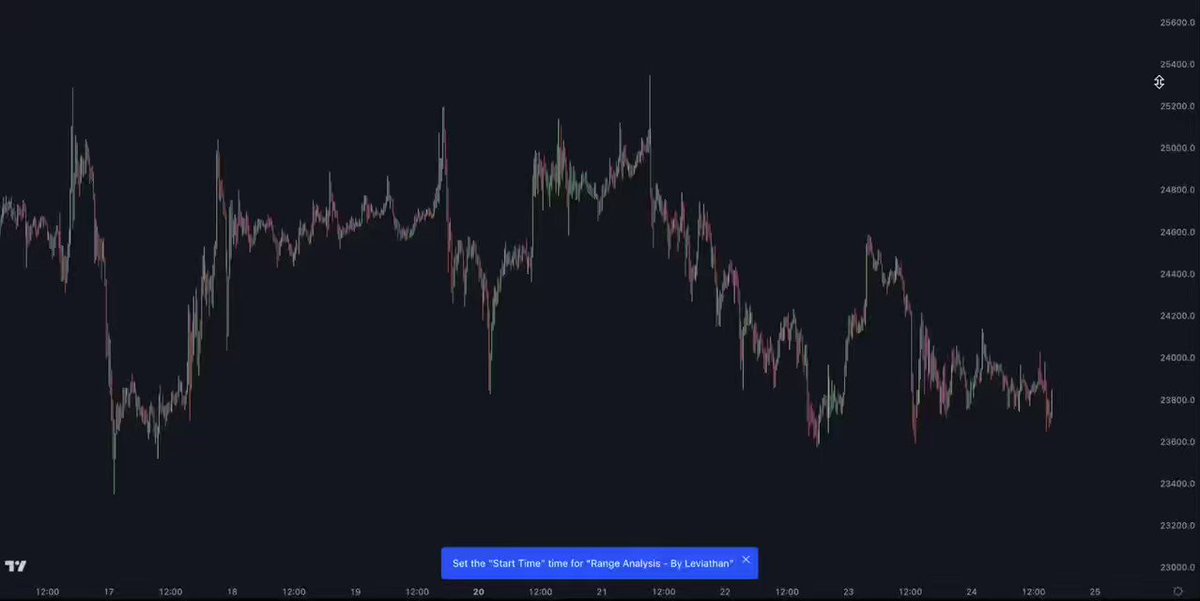
2. Pick the start time and end time of your range via Tradingview’s interactive function.
3. Explore the settings and enjoy :)
1. Visit this link, click “Add to my favorite indicators” and add it to your chart - tradingview.com
2. Pick the start time and end time of your range via Tradingview’s interactive function.
3. Explore the settings and enjoy :)
Range Levels
The script will automatically identify and draw important levels such as:
• Range high & low & 0.5
• Range Quarters
• Range Eighths
• Fibonacci levels
• VWAP
• Outer levels
The script will automatically identify and draw important levels such as:
• Range high & low & 0.5
• Range Quarters
• Range Eighths
• Fibonacci levels
• VWAP
• Outer levels
Volume/OI Heatmap
You can visualize the activity of Volume or Open Interest via two types of heatmaps that will help you find zones of interest.
Horizontal Heatmap
- Displays the volume/OI activity on price axis
Vertical Heatmap
- Displays the volume/OI activity on time axis
You can visualize the activity of Volume or Open Interest via two types of heatmaps that will help you find zones of interest.
Horizontal Heatmap
- Displays the volume/OI activity on price axis
Vertical Heatmap
- Displays the volume/OI activity on time axis

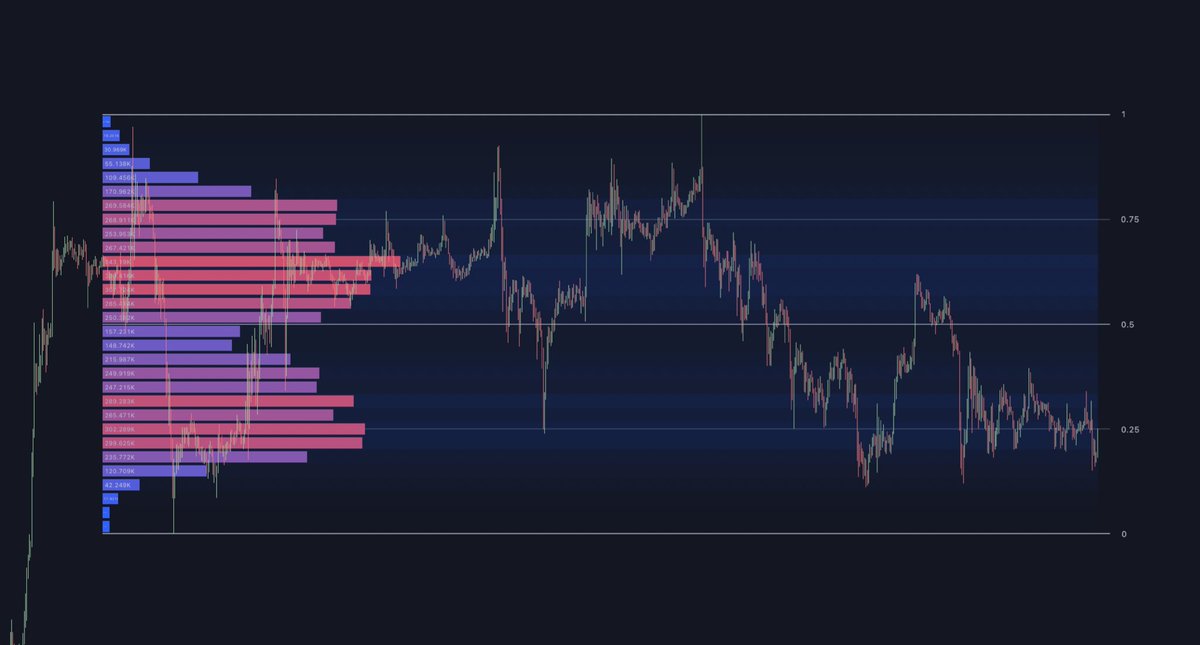
Volume Profile / Open Interest Profile
This offers an x-ray view into the market’s activity. Fully customizable appearance and advanced functionalities for displaying the distribution of Volume and Open Interest on price axis.
This offers an x-ray view into the market’s activity. Fully customizable appearance and advanced functionalities for displaying the distribution of Volume and Open Interest on price axis.

I didn’t have time to write a better thread but you can go read the script description and explore the indicator by yourself.
I sincerely hope this script helps you on your trading journey because it really make trading level-to-level so much easier.
If you want to get early…
I sincerely hope this script helps you on your trading journey because it really make trading level-to-level so much easier.
If you want to get early…
Loading suggestions...