

𝗧𝗿𝗮𝗱𝗶𝗻𝗴 𝗳𝗼𝗿 𝗮 𝗟𝗶𝘃𝗶𝗻𝗴
A Book BY DR ALEXANDER ELDER
🧵 Must Read Thread 🧵
A Book BY DR ALEXANDER ELDER
🧵 Must Read Thread 🧵

𝗣𝗶𝗹𝗹𝗮𝗿𝘀 𝗼𝗳 𝗮 𝗧𝗿𝗮𝗱𝗶𝗻𝗴
🔸 𝘗𝘴𝘺𝘤𝘩𝘰𝘭𝘰𝘨𝘺
🔸 𝘔𝘢𝘳𝘬𝘦𝘵 𝘈𝘯𝘢𝘭𝘺𝘴𝘪𝘴 𝘢𝘯𝘥 𝘛𝘳𝘢𝘥𝘪𝘯𝘨 𝘚𝘺𝘴𝘵𝘦𝘮𝘴
🔸 𝘔𝘰𝘯𝘦𝘺 𝘔𝘢𝘯𝘢𝘨𝘦𝘮𝘦𝘯𝘵
[2/18]
🔸 𝘗𝘴𝘺𝘤𝘩𝘰𝘭𝘰𝘨𝘺
🔸 𝘔𝘢𝘳𝘬𝘦𝘵 𝘈𝘯𝘢𝘭𝘺𝘴𝘪𝘴 𝘢𝘯𝘥 𝘛𝘳𝘢𝘥𝘪𝘯𝘨 𝘚𝘺𝘴𝘵𝘦𝘮𝘴
🔸 𝘔𝘰𝘯𝘦𝘺 𝘔𝘢𝘯𝘢𝘨𝘦𝘮𝘦𝘯𝘵
[2/18]
How to keep Emotions in check ?
🔸 𝗕𝗲 𝗥𝗲𝗮𝗹𝗶𝘀𝘁𝗶𝗰 : Don’t Expect 10% in a month or doubling your account every 6 months , Anywhere between 2 to 5% per month is a great return
🔸 Keep a Trading Journal : helps you identify your weakness , strengths.
[3/18]
🔸 𝗕𝗲 𝗥𝗲𝗮𝗹𝗶𝘀𝘁𝗶𝗰 : Don’t Expect 10% in a month or doubling your account every 6 months , Anywhere between 2 to 5% per month is a great return
🔸 Keep a Trading Journal : helps you identify your weakness , strengths.
[3/18]
🔸 Set up rules of exit before entering a trade .
🔸 Stop Trading if you feel you are overtrading , and feel your performance is lagging , Its OKAY not to trade !
[4/18]
🔸 Stop Trading if you feel you are overtrading , and feel your performance is lagging , Its OKAY not to trade !
[4/18]
🔸 𝗗𝗼𝗻'𝘁 𝗖𝗼𝘂𝗻𝘁 𝗠𝗼𝗻𝗲𝘆 : Follow the process and don’t run behind money , if you are disciplines , have a profitable system , money will automatically come it !
🔸 Practise Sound 𝗠𝗼𝗻𝗲𝘆 𝗠𝗮𝗻𝗮𝗴𝗲𝗺𝗲𝗻𝘁( Position Sizing , Stoploss )
[5/18
🔸 Practise Sound 𝗠𝗼𝗻𝗲𝘆 𝗠𝗮𝗻𝗮𝗴𝗲𝗺𝗲𝗻𝘁( Position Sizing , Stoploss )
[5/18
One Indicator to rule them all ?
Different Indicators , Different uses , Different Situations
🔸 Long Term Trend Indicator ( MACD ,EMAs ADX )
🔸 OSCILLATOR ( Stochastics , RSI , MFI)
🔸 You cannot use a Trend Following indicator in sideways market
[6/18
Different Indicators , Different uses , Different Situations
🔸 Long Term Trend Indicator ( MACD ,EMAs ADX )
🔸 OSCILLATOR ( Stochastics , RSI , MFI)
🔸 You cannot use a Trend Following indicator in sideways market
[6/18
3. Rules of Thumb to use Indicators
EMAs is better than SMAs And focus on recent price data rather than average price data over a longer period of time
Weekly > Daily>Hourly> Intraday Charts
Use Few indicators , learn when to use , when not to use and how to use them
[7/18]
EMAs is better than SMAs And focus on recent price data rather than average price data over a longer period of time
Weekly > Daily>Hourly> Intraday Charts
Use Few indicators , learn when to use , when not to use and how to use them
[7/18]
𝟰. 𝗧𝗵𝗲 𝗧𝗿𝗶𝗽𝗹𝗲 𝗦𝗰𝗿𝗲𝗲𝗻 𝗧𝗿𝗮𝗱𝗶𝗻𝗴 𝗦𝘆𝘀𝘁𝗲𝗺
🔸 Trend is your friend ?
🔸 Buy Low , Sell High ?
🔸 Let your Profits Run ?
How high is high ?
And when to sell ?
Indicators can contradict each other , and they may Contradict itself.
[8/18]
🔸 Trend is your friend ?
🔸 Buy Low , Sell High ?
🔸 Let your Profits Run ?
How high is high ?
And when to sell ?
Indicators can contradict each other , and they may Contradict itself.
[8/18]
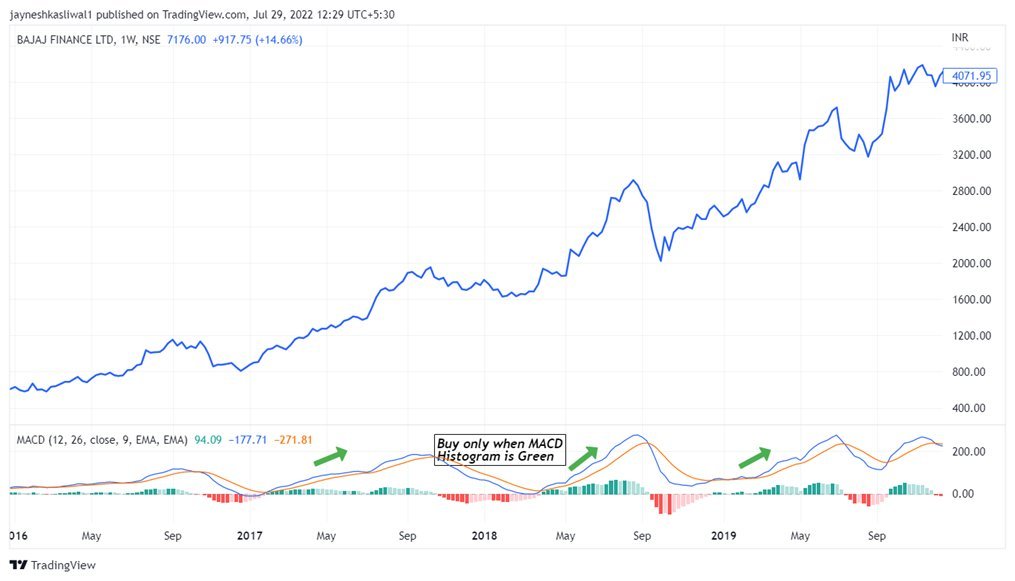
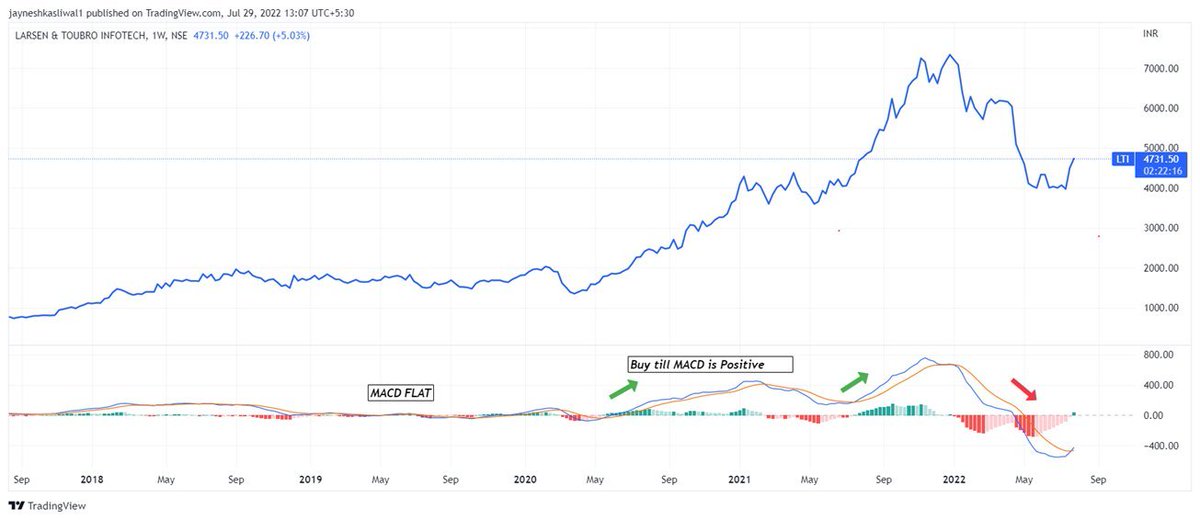
𝗠𝗮𝗿𝗸𝗲𝘁 𝗧𝗶𝗱𝗲
Use Weekly Trend following indicator to identify the longer term trend
Example : he uses MACD as a trend following indicator
[9/18]
Use Weekly Trend following indicator to identify the longer term trend
Example : he uses MACD as a trend following indicator
[9/18]
𝟯𝟬 𝗘𝗠𝗔 𝘃𝘀 𝗦𝘂𝗽𝗲𝗿𝘁𝗿𝗲𝗻𝗱 𝗪𝗲𝗲𝗸𝗹𝘆
[10/18]
[10/18]
![𝟯𝟬 𝗘𝗠𝗔 𝘃𝘀 𝗦𝘂𝗽𝗲𝗿𝘁𝗿𝗲𝗻𝗱 𝗪𝗲𝗲𝗸𝗹𝘆
[10/18] https://t.co/UKjPMRJ3zT](https://pbs.twimg.com/media/FohhXAcakAAU4Qk.jpg)
![𝟯𝟬 𝗘𝗠𝗔 𝘃𝘀 𝗦𝘂𝗽𝗲𝗿𝘁𝗿𝗲𝗻𝗱 𝗪𝗲𝗲𝗸𝗹𝘆
[10/18] https://t.co/UKjPMRJ3zT](https://pbs.twimg.com/media/FohhY3aaYAEoXje.jpg)
Market wave : Need to buy at correct places even in longer term trend as you may get stopped out
𝗜𝗻𝘁𝗿𝗮𝗱𝗮𝘆 𝗕𝗿𝗲𝗮𝗸𝗼𝘂𝘁
•When buying use Buying -Sell Stop and enter on breakouts if the longer term allows you to buy and Use stoploss as breakout candle low
[11/18]
𝗜𝗻𝘁𝗿𝗮𝗱𝗮𝘆 𝗕𝗿𝗲𝗮𝗸𝗼𝘂𝘁
•When buying use Buying -Sell Stop and enter on breakouts if the longer term allows you to buy and Use stoploss as breakout candle low
[11/18]
The Triple Confirmation Trading System
[12/18]
[12/18]
![The Triple Confirmation Trading System
[12/18] https://t.co/RR7R8alEov](https://pbs.twimg.com/media/Fohhk6bakAAfcdn.jpg)
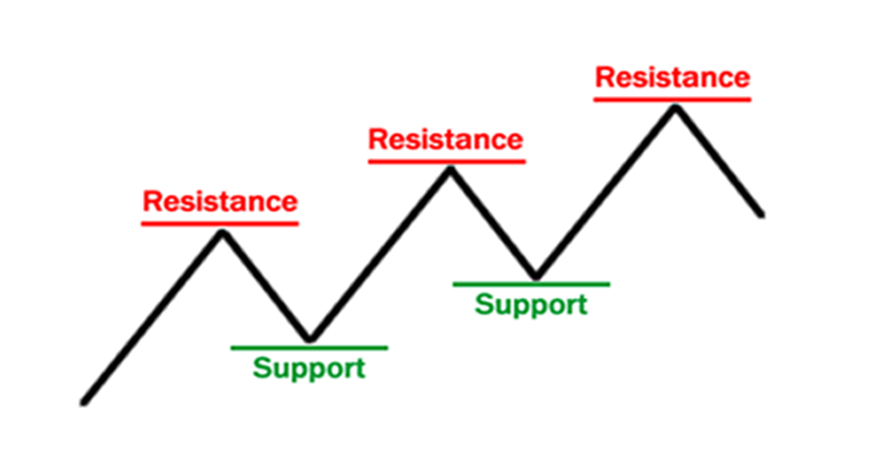
Chart and technical analysis
🔸 Focus on basic Support and Resistance which increases your probability
🔸 Focus on chart patterns, candlesticks
[13/18]
🔸 Focus on basic Support and Resistance which increases your probability
🔸 Focus on chart patterns, candlesticks
[13/18]
𝗣𝗼𝘀𝗶𝘁𝗶𝗼𝗻 𝗦𝗶𝘇𝗶𝗻𝗴
If you are long , then shift your stoploss upwards and not downwards !
How to Position Size ?
Capital = 1,00,000
Risk Per day = 2000
Stock Price =100
Stoploss = 90 ( Example Low of candle )
Qty = 2000/10 Rs
Total Qty = 200 !
[14/18]
If you are long , then shift your stoploss upwards and not downwards !
How to Position Size ?
Capital = 1,00,000
Risk Per day = 2000
Stock Price =100
Stoploss = 90 ( Example Low of candle )
Qty = 2000/10 Rs
Total Qty = 200 !
[14/18]
𝗠𝗼𝗻𝗲𝘆 𝗠𝗮𝗻𝗮𝗴𝗲𝗺𝗲𝗻𝘁 𝟭𝟬𝟭
1.Survival,
2.Steady returns,
3.High returns
[15/18]
1.Survival,
2.Steady returns,
3.High returns
[15/18]

If you like this thread please retweet the first tweet and follow me for more!
@JayneshKasliwal
@JayneshKasliwal
جاري تحميل الاقتراحات...