

Here is one of my Best Entry Model that works 70% of the time.
And here is how you can increase your win rate with it.
A short thread 🧵🪡
And here is how you can increase your win rate with it.
A short thread 🧵🪡


In the next 3 minutes I'll show you how to identify the Highest Probability Flip Zones to trade from.
But before then, kindly retweet the first tweet for others to see.
Done?
Thank you my comrade 👍
Now let's face it 👇
But before then, kindly retweet the first tweet for others to see.
Done?
Thank you my comrade 👍
Now let's face it 👇
First things first, supply and demand zones are everywhere on the charts.
I mean, every turning point.
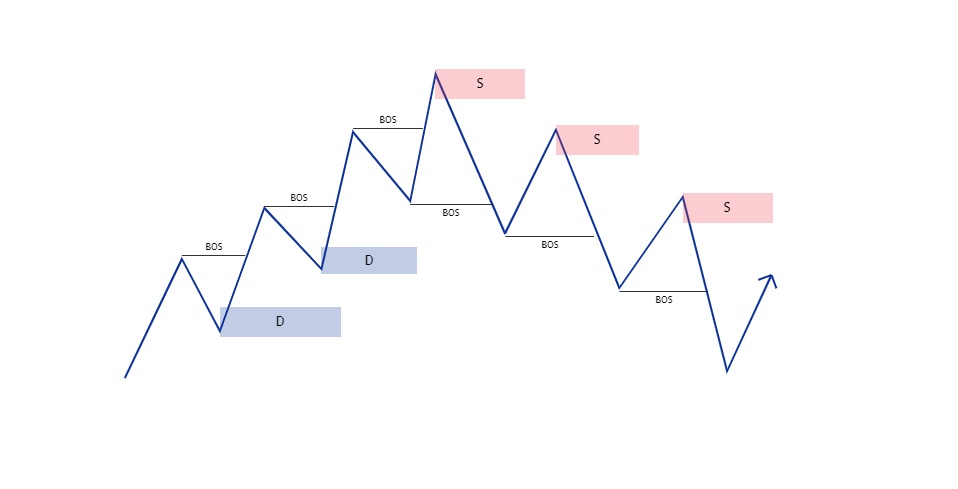
Each time price is moving upward and turns around to make a pullback, there will be Supply (S) created above.
Vise versa for Demand (D)
Example 👇
I mean, every turning point.
Each time price is moving upward and turns around to make a pullback, there will be Supply (S) created above.
Vise versa for Demand (D)
Example 👇

With that being established, if you should go and start mapping out every single S&D zone you identify, your chart will be a total mess.
Because they are every single where.
Therefore, we separate them out and focus on those that really matters. 👇
Because they are every single where.
Therefore, we separate them out and focus on those that really matters. 👇
There are two main ways we validate a Strong S&D zone. First is:
• Structural Zones - zones that led to a Break of Market Structure (BOS).
So instead of drawing every single zone you see, you focus only on the ones that achieved something significant - caused a BOS
Example 👇
• Structural Zones - zones that led to a Break of Market Structure (BOS).
So instead of drawing every single zone you see, you focus only on the ones that achieved something significant - caused a BOS
Example 👇
The second main way we validate a strong S&D zones are what we call:
• Flip Zones - zones that overpower and takes out another 'valid zone' before it was created.
So not only does it led to a BOS, but it also caused another valid zone to fail in the process.
Example 👇
• Flip Zones - zones that overpower and takes out another 'valid zone' before it was created.
So not only does it led to a BOS, but it also caused another valid zone to fail in the process.
Example 👇
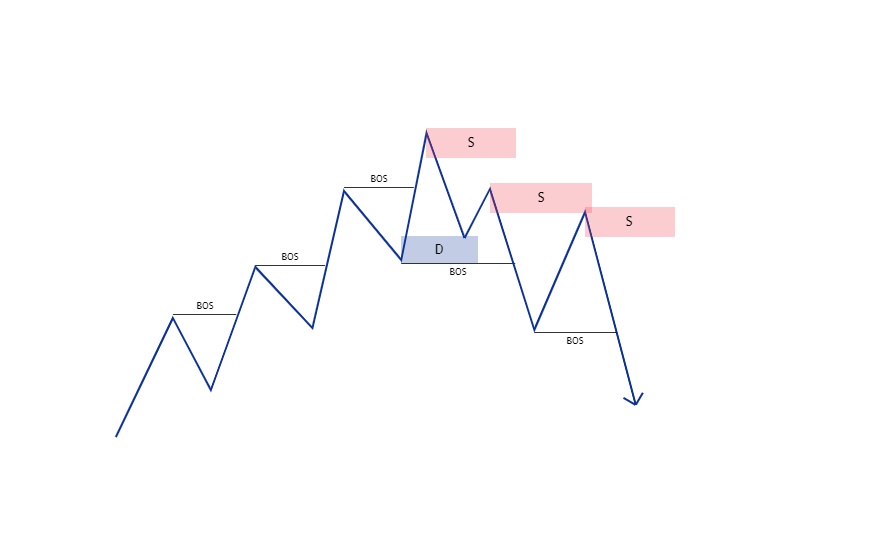
When you identify a zone that caused another valid zone to fail, this is your highest probability zone.
You can see how in the image below 👇, it was the demand that led to the 3rd BOS to the upside,
Now because price is bullish, expectations is that price should...
You can see how in the image below 👇, it was the demand that led to the 3rd BOS to the upside,
Now because price is bullish, expectations is that price should...
...pullback into demand, form a higher low and continue upward to cause another BOS.
But you can clearly see what happened, it pulled back and reacted to the demand zone.
It showed some signs of bullish move, but then failed because supply overpowered and took out the demand.
But you can clearly see what happened, it pulled back and reacted to the demand zone.
It showed some signs of bullish move, but then failed because supply overpowered and took out the demand.
IMPORTANT NOTE: That reaction is key.
You need to clearly see that the 'valid zone' tried to push price upward or downward as the case may be, before it was then overpowered and failed.
If there's no reaction, then it's not a FLIP 🚫
You need to clearly see that the 'valid zone' tried to push price upward or downward as the case may be, before it was then overpowered and failed.
If there's no reaction, then it's not a FLIP 🚫
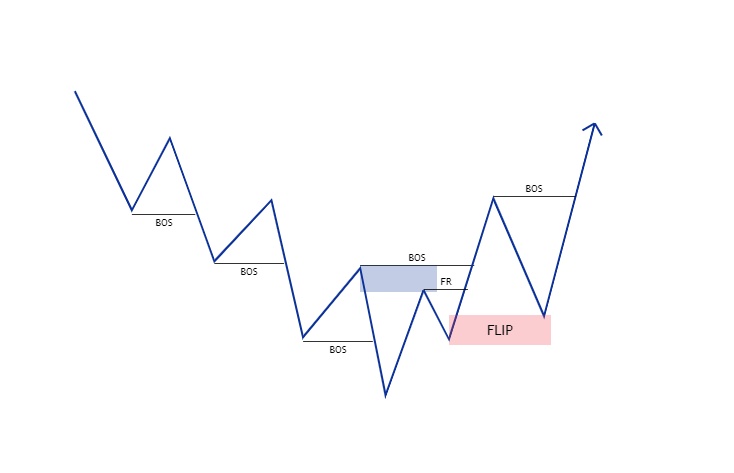
S2D Flip, D2S Flip:
When price reacts to a valid demand and it fails to hold, that demand is then flipped into supply (D2S)
Same way when price reaches a valid supply zone and reacts to it but then the valid zone fails to hold,
then the supply is now flipped into demand (S2D)
When price reacts to a valid demand and it fails to hold, that demand is then flipped into supply (D2S)
Same way when price reaches a valid supply zone and reacts to it but then the valid zone fails to hold,
then the supply is now flipped into demand (S2D)
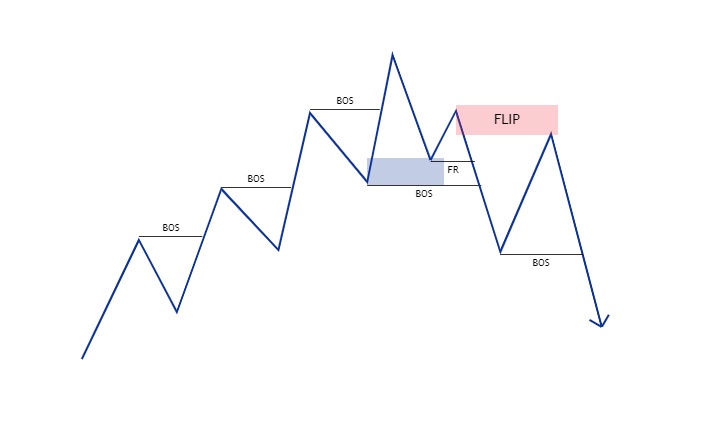
Now that you understand what flips zones are, how do you trade them you ask?
From the starting point of the reaction, to the highest (or lowest if it's S2D) point is the FLIP, but you can refine it to the last pivot candle, and set your entry there.
Example 👇
From the starting point of the reaction, to the highest (or lowest if it's S2D) point is the FLIP, but you can refine it to the last pivot candle, and set your entry there.
Example 👇
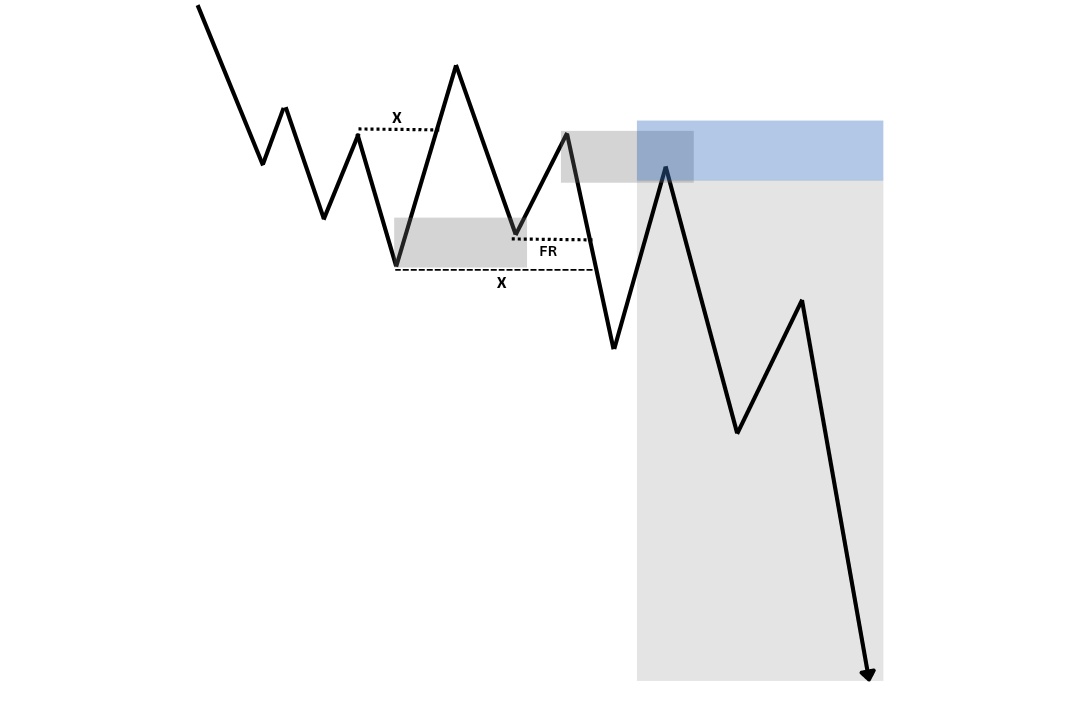
In the image above, notice how price was bearish and trending downward, then we saw demand overpowered supply (without FLIP) and caused a BOS to the upside..
Now that price is bullish, we expect it to pullback into the strong demand and continue the bullish orderflow..
Now that price is bullish, we expect it to pullback into the strong demand and continue the bullish orderflow..
But price pulled back and tried to continue bullish - demand was trying to push price upward,
But supply came in aggressively and overpowered it, causing a D2S Flip.
The FR - stands for Failed Reaction..
You draw it from the starting point of the reaction, to where it failed.
But supply came in aggressively and overpowered it, causing a D2S Flip.
The FR - stands for Failed Reaction..
You draw it from the starting point of the reaction, to where it failed.
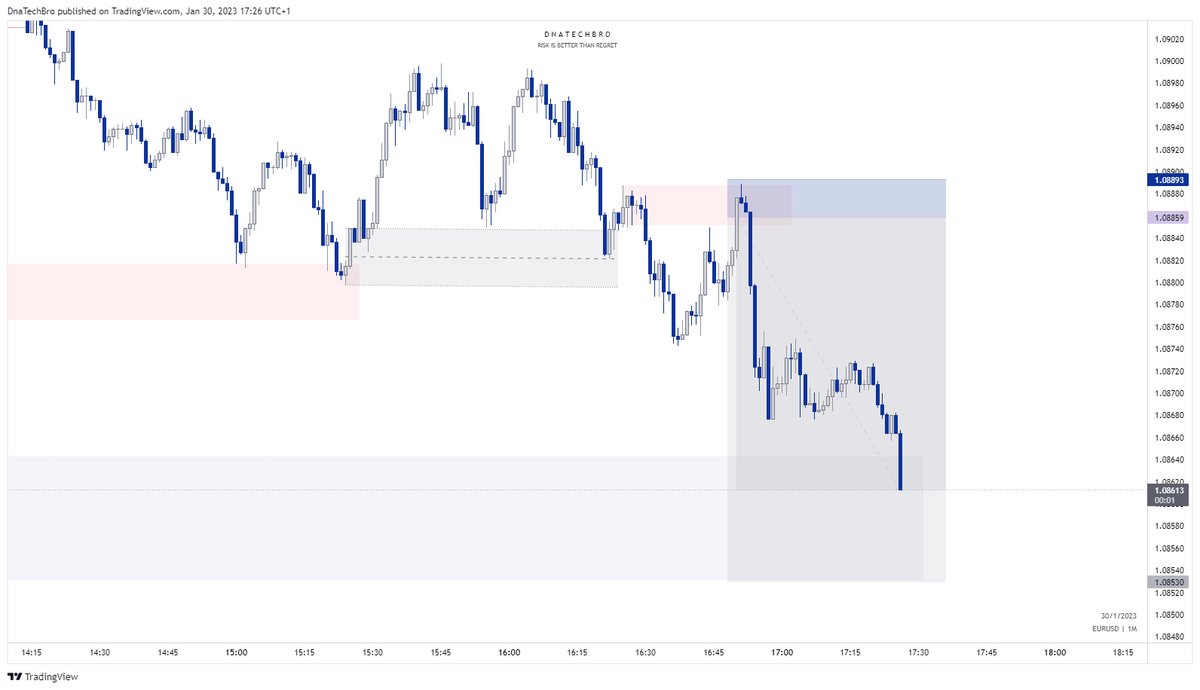
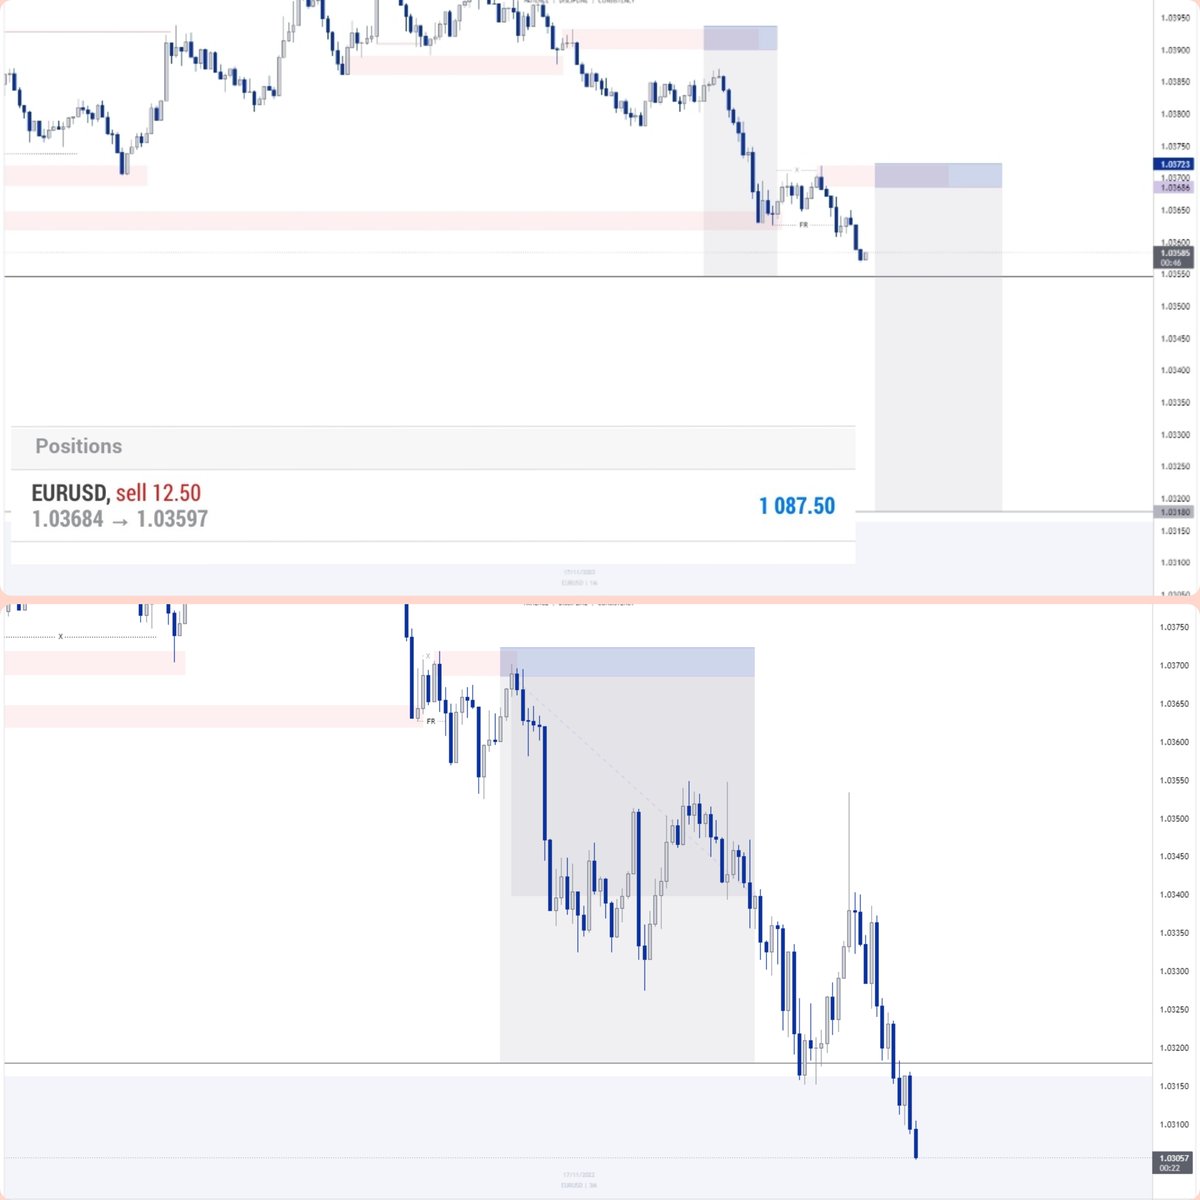
Now all those are more like textbook example, it won't happen that exact way in the live market.
Here is a more realistic example below 👇
And of course I didn't hesitate to execute the trade because I so much love this entry model.
Here is a more realistic example below 👇
And of course I didn't hesitate to execute the trade because I so much love this entry model.
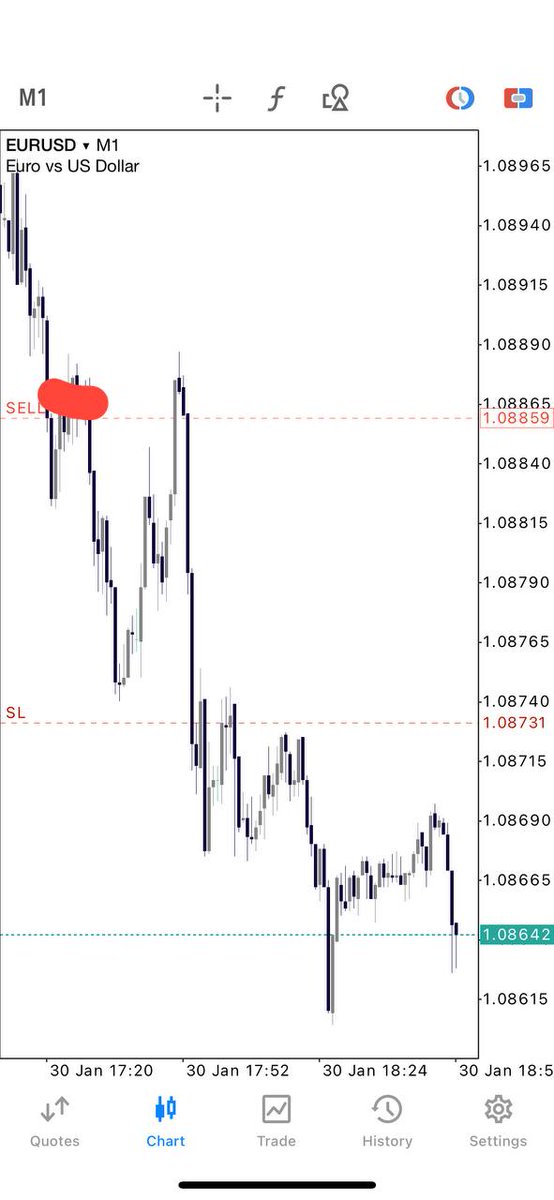
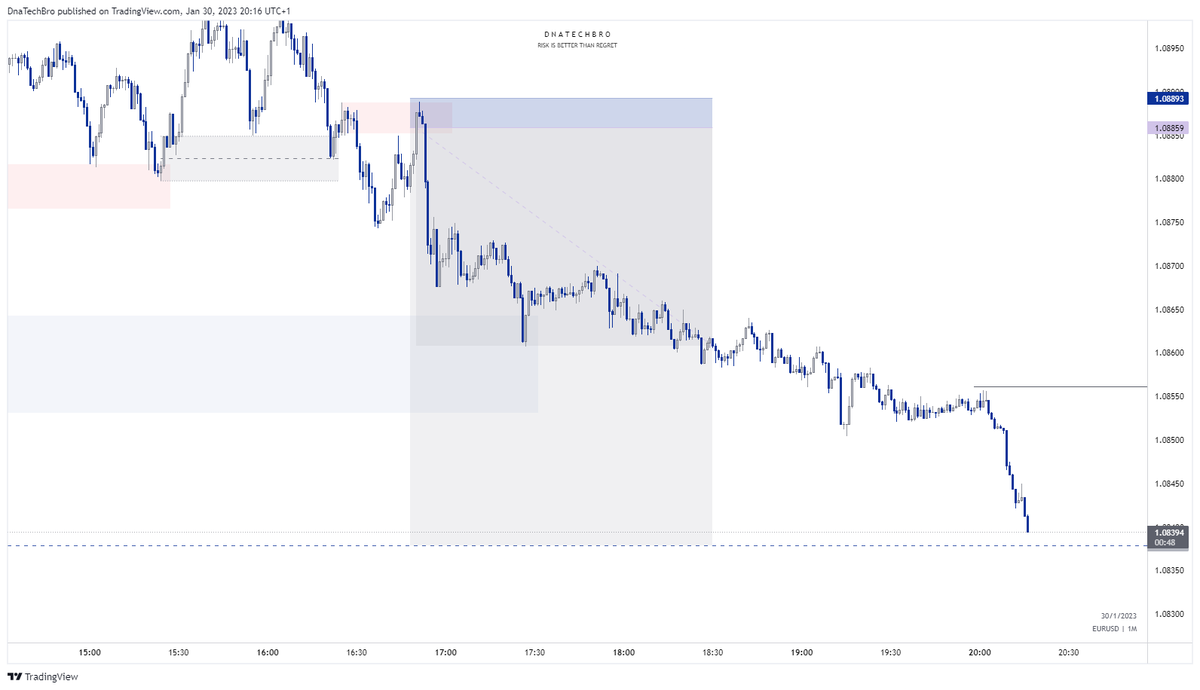
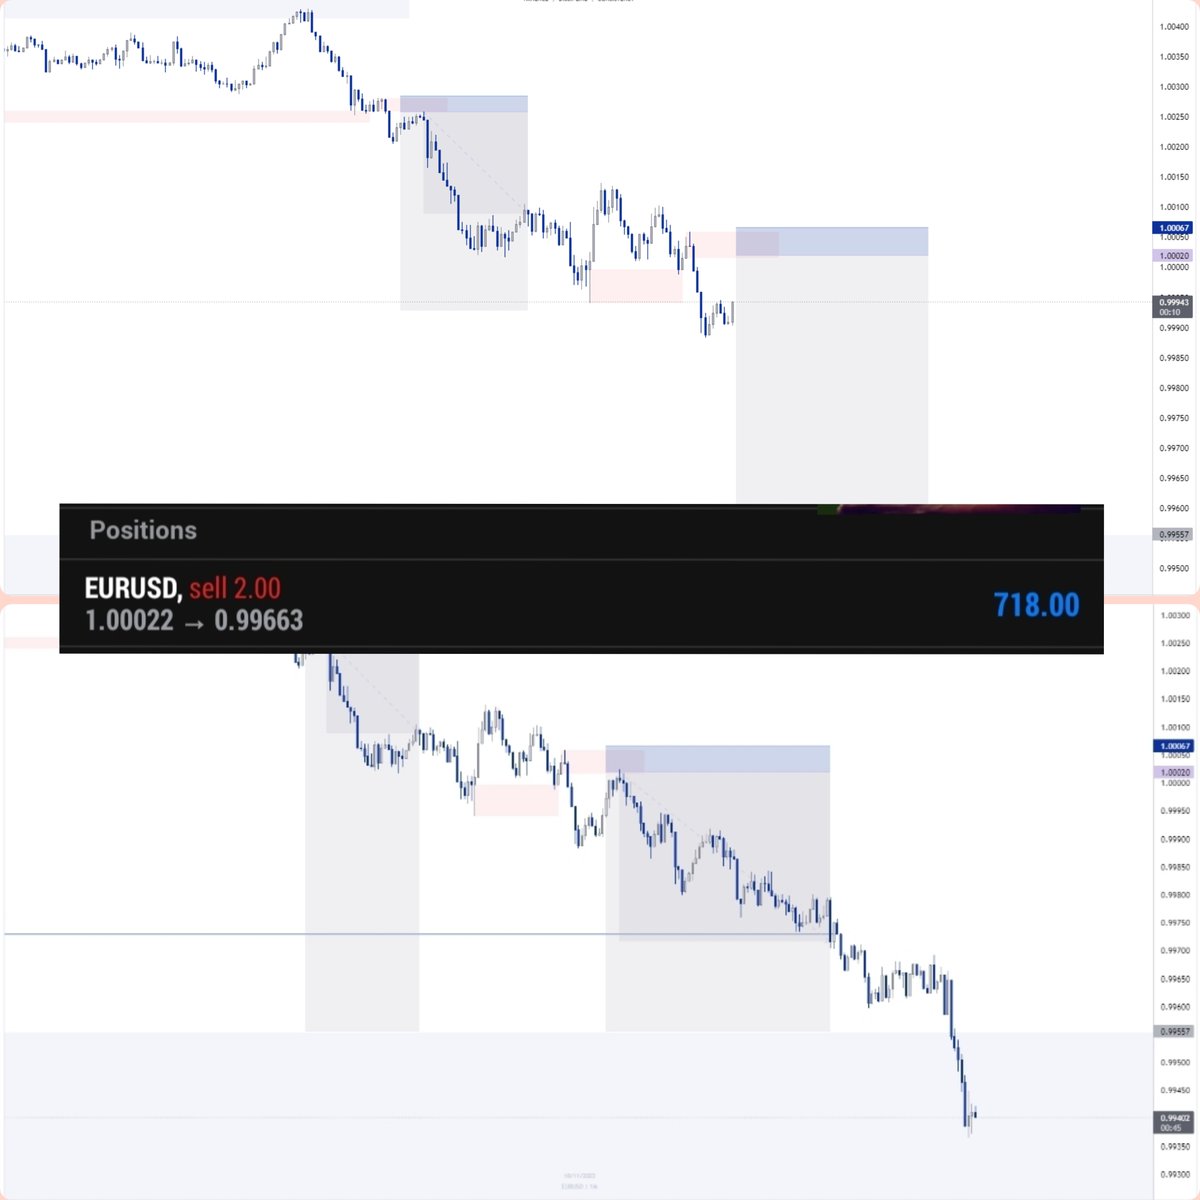
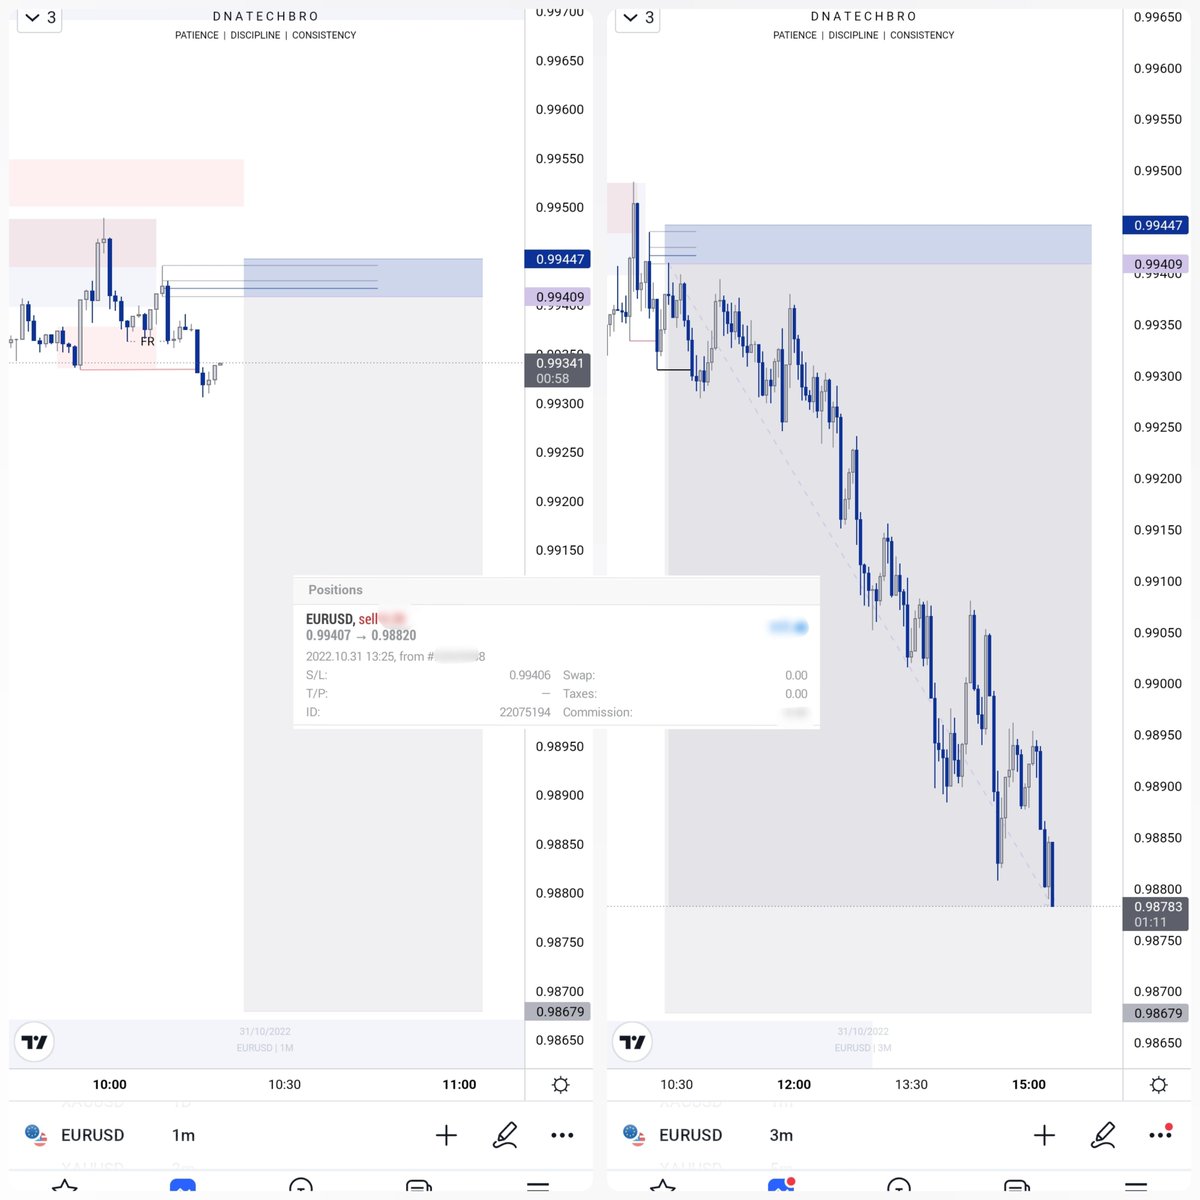
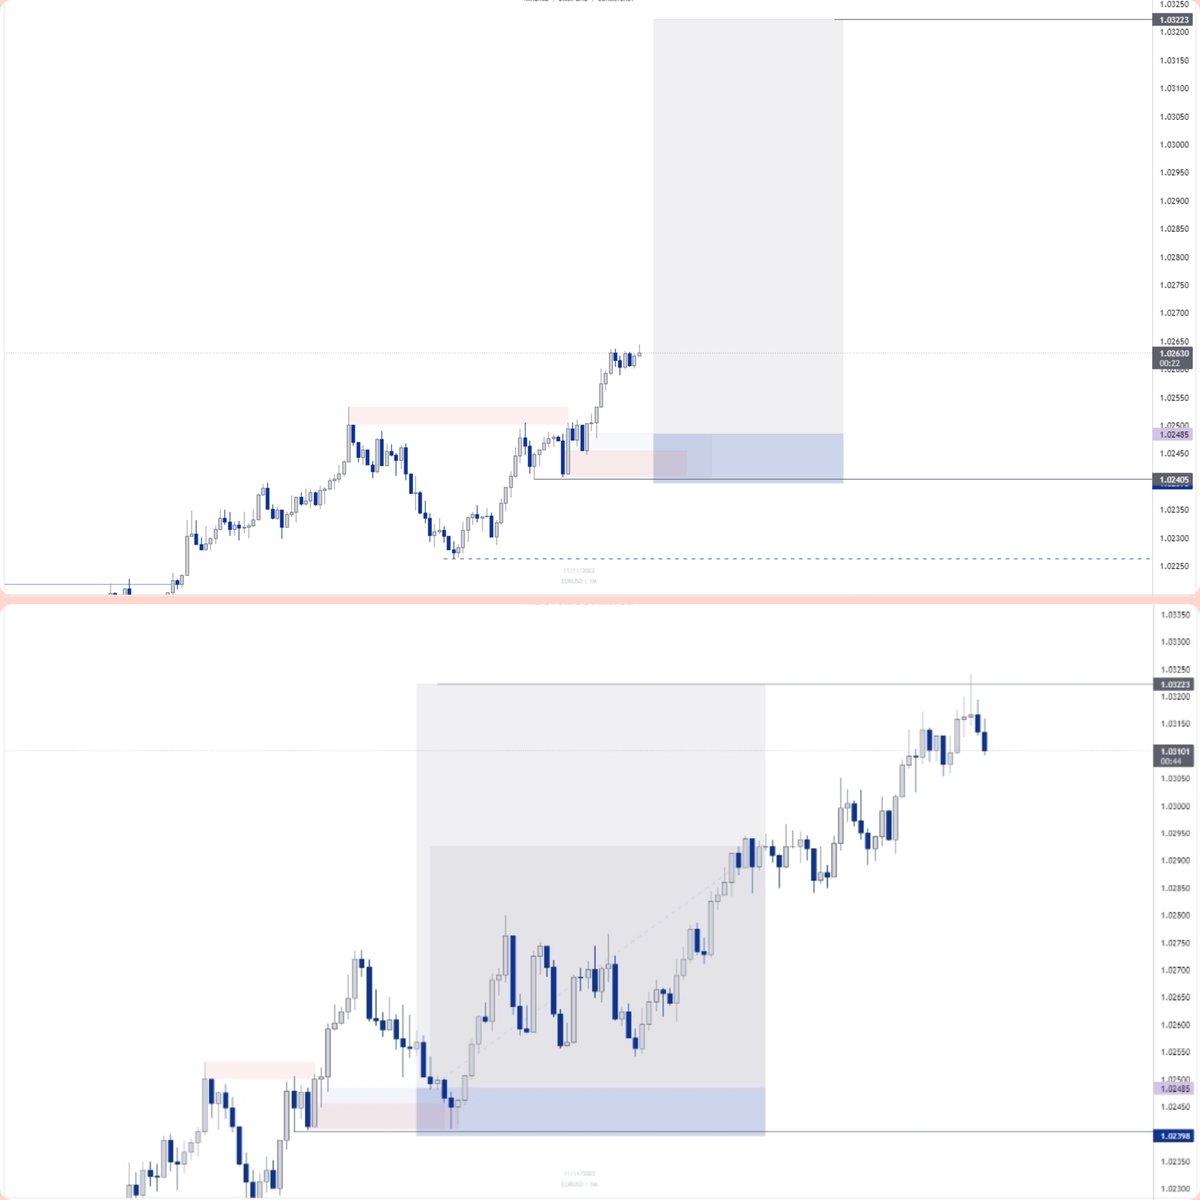
Here are some few more examples from the plenty data that I've collected to prove that this works (most of the time).
And you can see more examples in my FREE Telegram channel: t.me
And you can see more examples in my FREE Telegram channel: t.me

And that's a wrap (hopefully it didn't exceed 3 minutes 😂❤️)
I hope you found this helpful?
Now go and backtest it and also try it out in the live market.. I'll be waiting for feedback too.
Don't forget to like & RT this for others to see,
And follow me @dnatechbro for more.
I hope you found this helpful?
Now go and backtest it and also try it out in the live market.. I'll be waiting for feedback too.
Don't forget to like & RT this for others to see,
And follow me @dnatechbro for more.
Loading suggestions...