

Alot of Traders hear Indicators and feel very indifferent about using them
Well Indicators are not such a bad thing,as long as you're using them in combination with your proper Analysis.
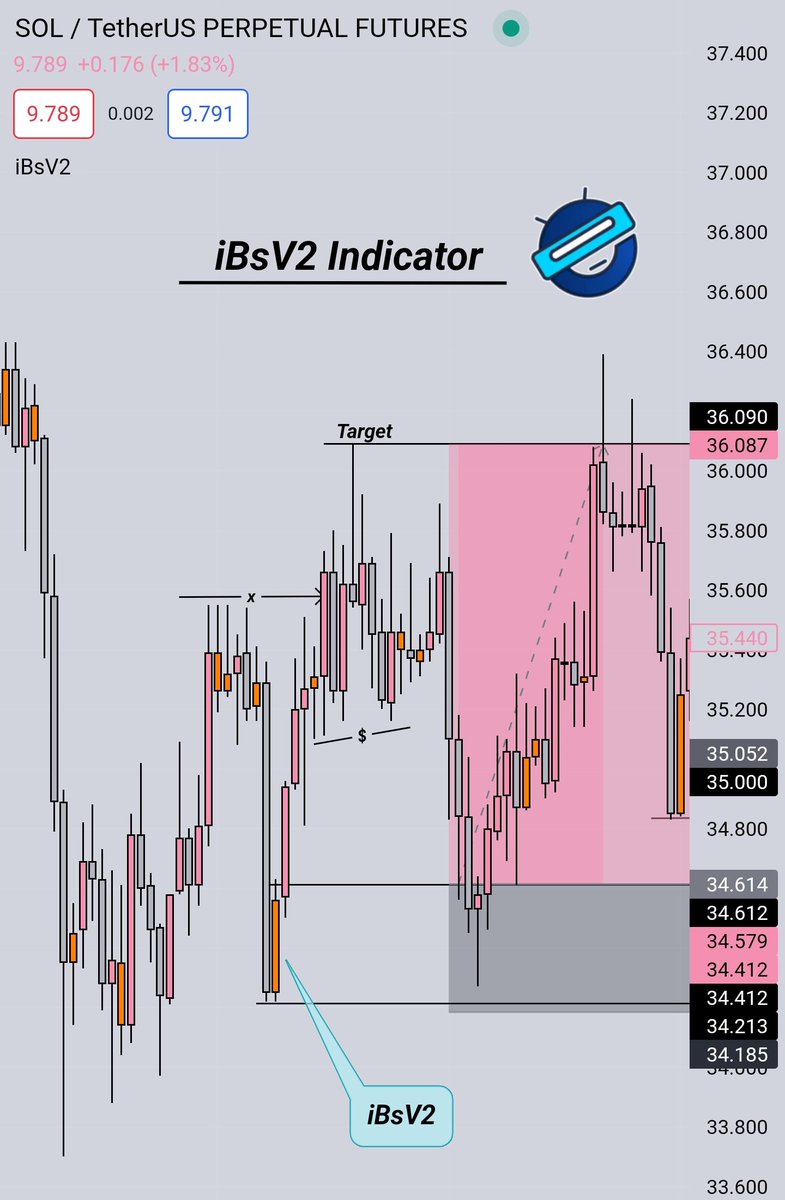
In this thread I'd show you how I used the iBsV2 indicator to catch multiple RR on SOL scalp
Well Indicators are not such a bad thing,as long as you're using them in combination with your proper Analysis.
In this thread I'd show you how I used the iBsV2 indicator to catch multiple RR on SOL scalp
Now firstly what is the iBsV2 indicator ?
The iBsV2 indicator fully called [ inside bar volume ]. It shows or highlights for you specific candles which have good volume, orders or volatility on them
The iBsV2 indicator fully called [ inside bar volume ]. It shows or highlights for you specific candles which have good volume, orders or volatility on them
Now as a good Technical Analyst you need not to trade using this indicator in isolation. The indicator must be in line or align properly with your structural bias (Market structure) and your Point of interest (POI)
Don't worry I'd use lots of pictorial representation to guide you through this thread and show you the various trades I took on SOL scalp that was fully sponsored by the indicator😅
so sit back and stay with me ⬇️⬇️
so sit back and stay with me ⬇️⬇️
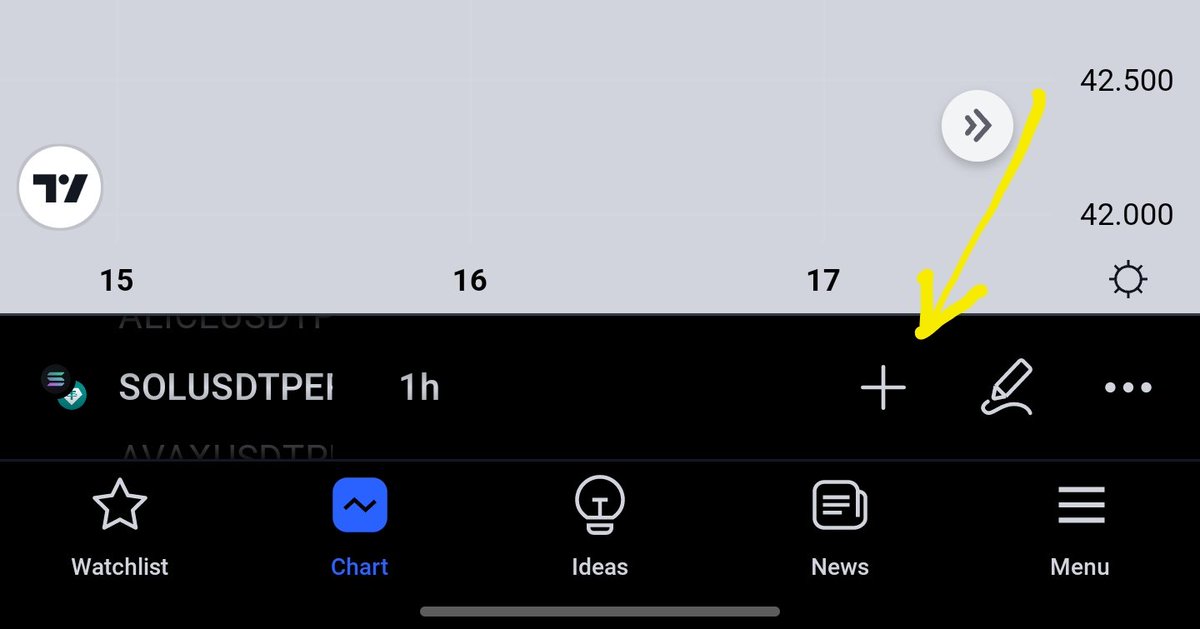
Let's first add the indicator to our chart
Here's a guide on how to do that
First click on the + icon on your trading view
Then tap on fx indicators
Here's a guide on how to do that
First click on the + icon on your trading view
Then tap on fx indicators
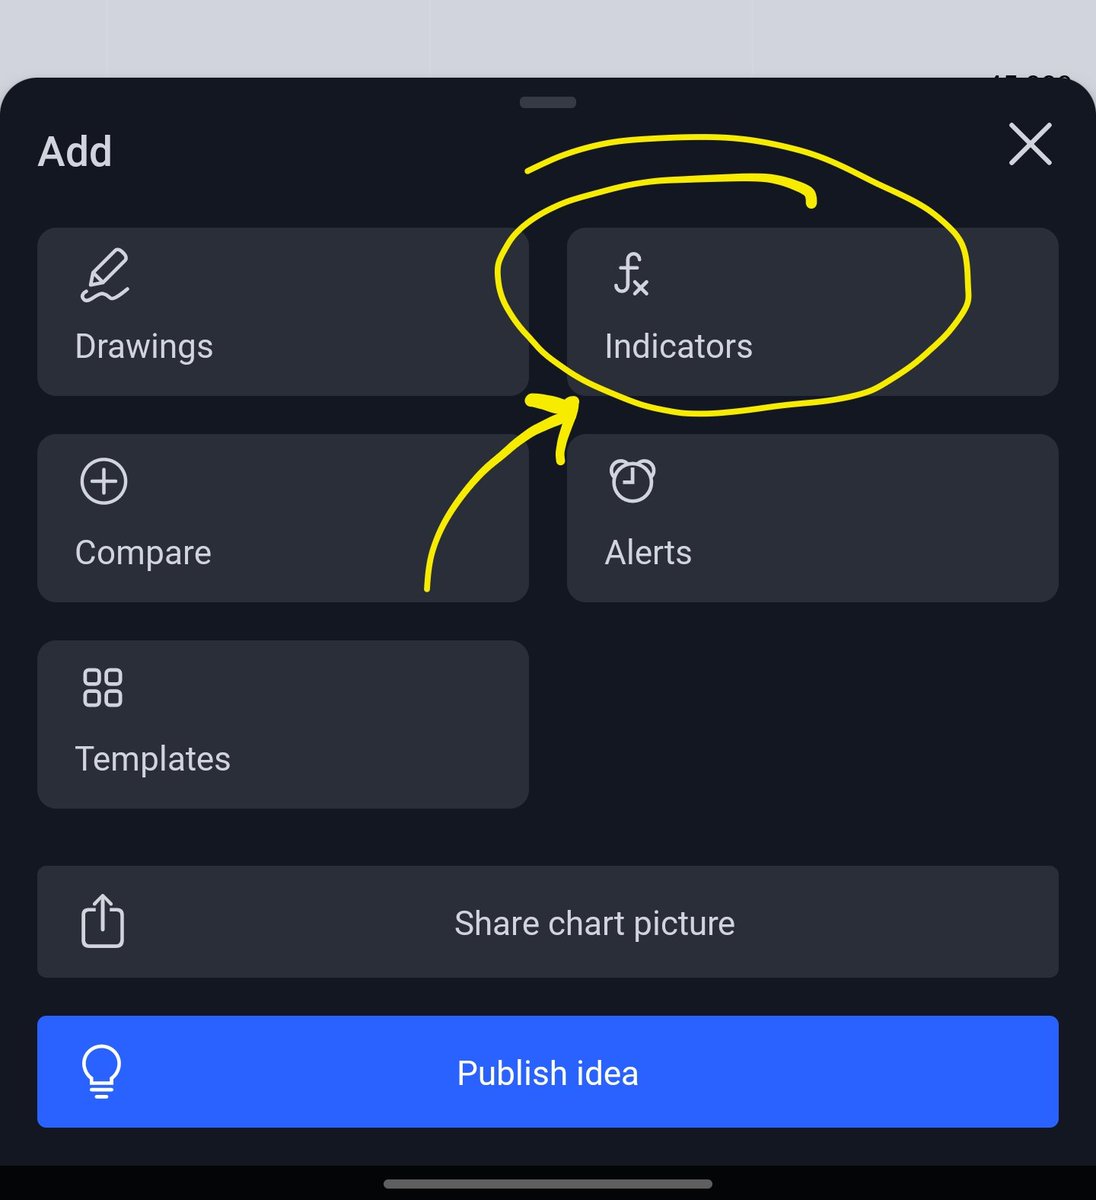
After that - search on [ Inside bar volume ]
It would bring out this below, then click on star icon, so it doesn't leave your indicator list easily, also tap on it to add it to your indicators list
That's all
Set & customize appropriately as you wish 🤗🤗
Pictures below
It would bring out this below, then click on star icon, so it doesn't leave your indicator list easily, also tap on it to add it to your indicators list
That's all
Set & customize appropriately as you wish 🤗🤗
Pictures below
![After that - search on [ Inside bar volume ]
It would bring out this below, then click on star icon...](https://pbs.twimg.com/media/FlNvuiiX0AEDtqS.jpg)
![After that - search on [ Inside bar volume ]
It would bring out this below, then click on star icon...](https://pbs.twimg.com/media/FlNvuzGWYAA2mQr.jpg)
![After that - search on [ Inside bar volume ]
It would bring out this below, then click on star icon...](https://pbs.twimg.com/media/FlNvvMlXEAEAiXk.jpg)
Now that is set
My iBsV2 tool is colored Orange anyways, so you'd be seeing my chart with 3 colors
Don't think it's magic, it's not😄😄
It's just the indicator doing it's thing
Now one thing I need you to understand is this
Read properly below on the pictures
My iBsV2 tool is colored Orange anyways, so you'd be seeing my chart with 3 colors
Don't think it's magic, it's not😄😄
It's just the indicator doing it's thing
Now one thing I need you to understand is this
Read properly below on the pictures

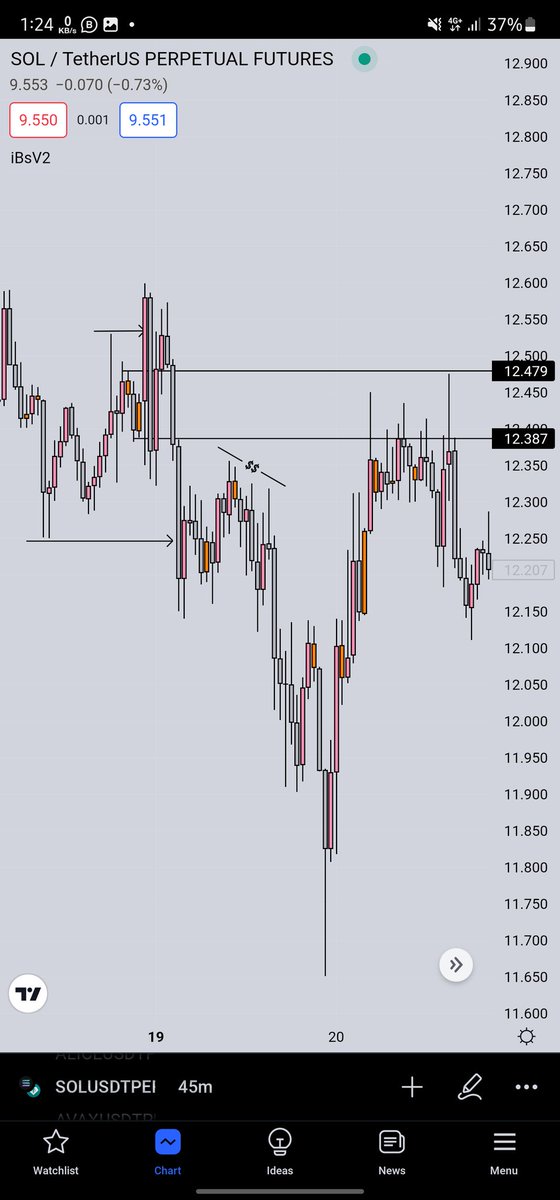
Time for some examples right ??
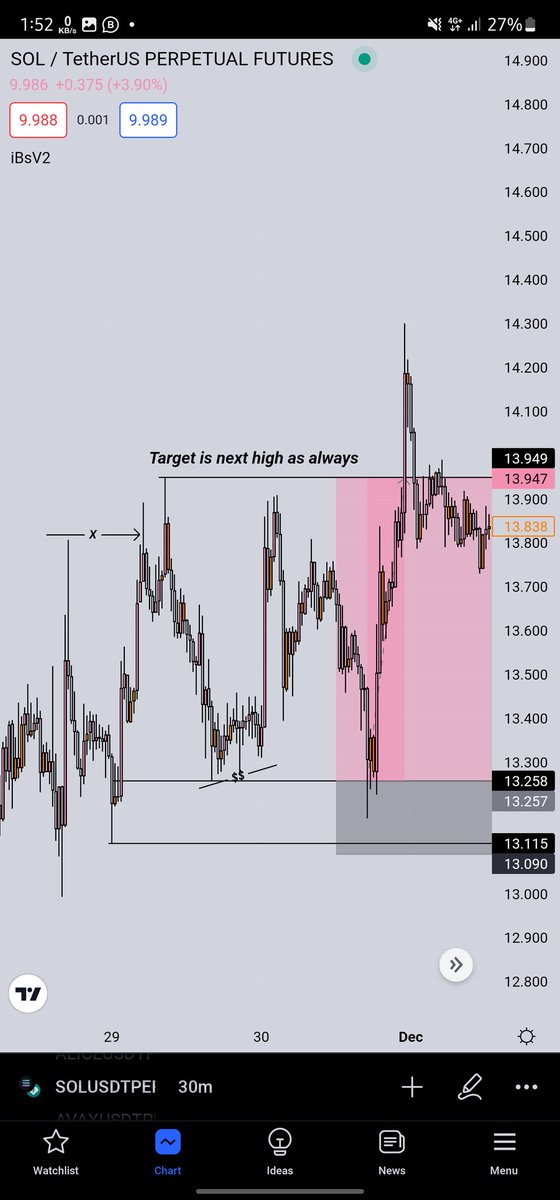
Let's look at how I combined the indicator with my POI on multiple short trades I executed with SOL/USDT
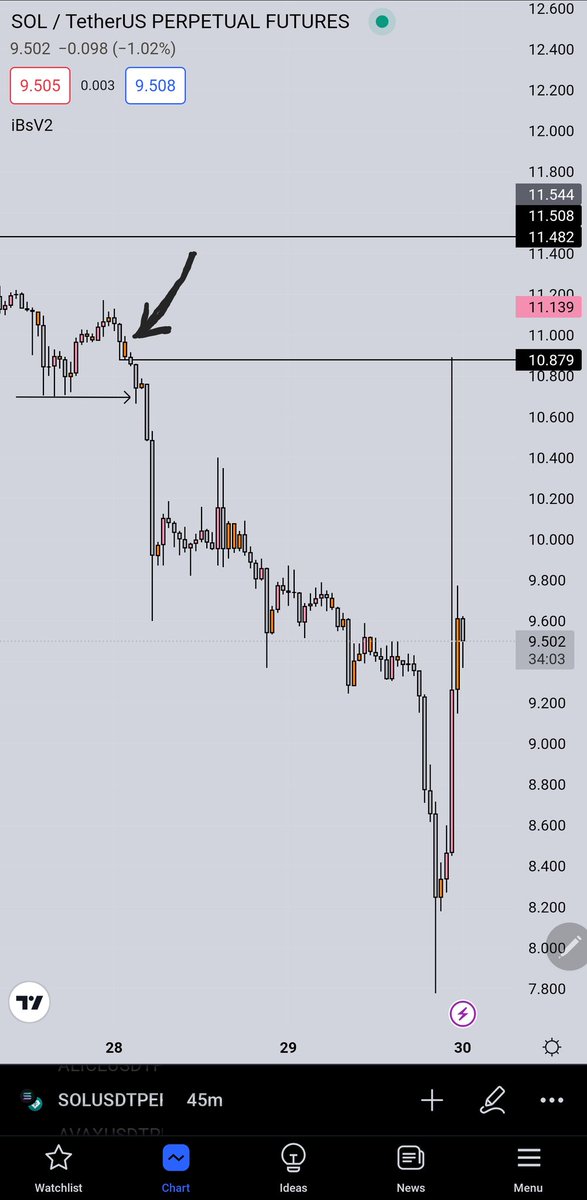
This was just yesterday night
When Solana kept dipping, look at the exact point and tell me what you see
The iBsV2 reaction right ??😁
Let's look at how I combined the indicator with my POI on multiple short trades I executed with SOL/USDT
This was just yesterday night
When Solana kept dipping, look at the exact point and tell me what you see
The iBsV2 reaction right ??😁
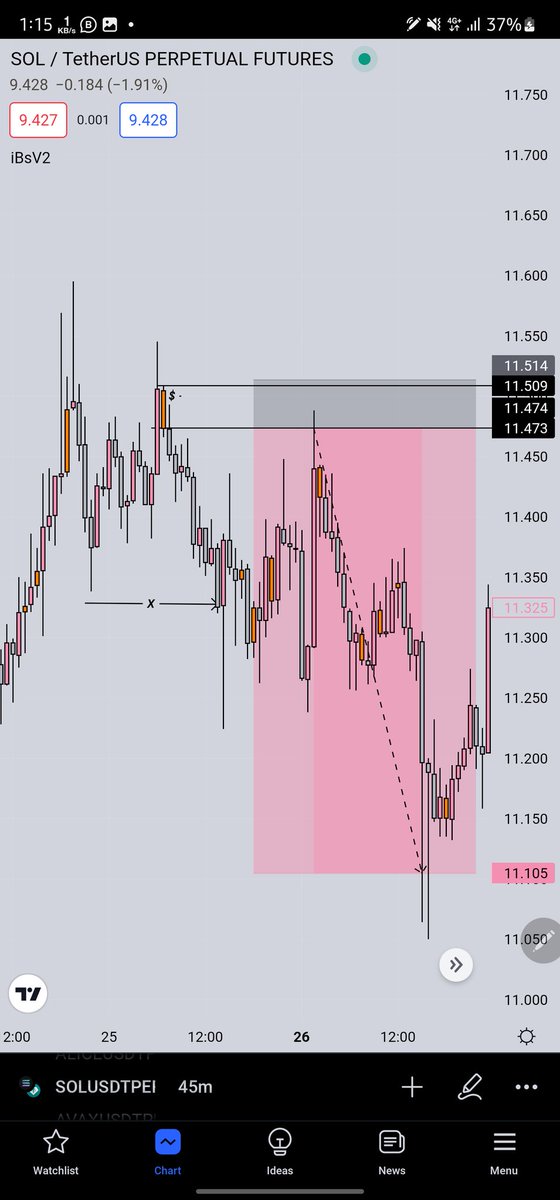
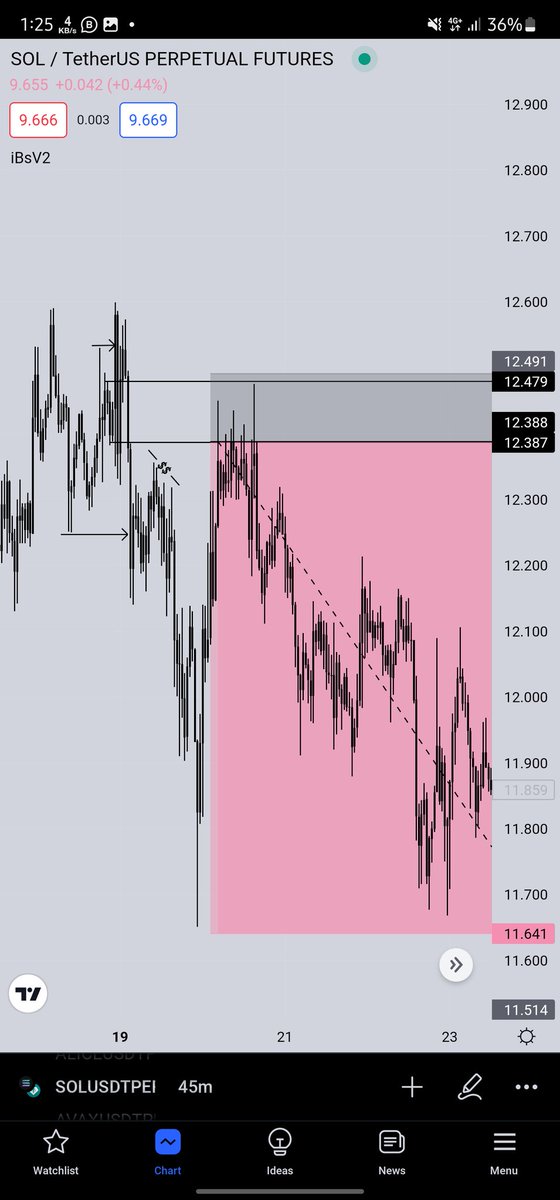
I have some other examples to show you exactly how I combine them with my POI on any trade I execute !!
They just serve to give more confidence and confirmation or more like an added confluence, that's all
Don't get over dependent on them
It's NO miracle solution to your SLs lol
They just serve to give more confidence and confirmation or more like an added confluence, that's all
Don't get over dependent on them
It's NO miracle solution to your SLs lol
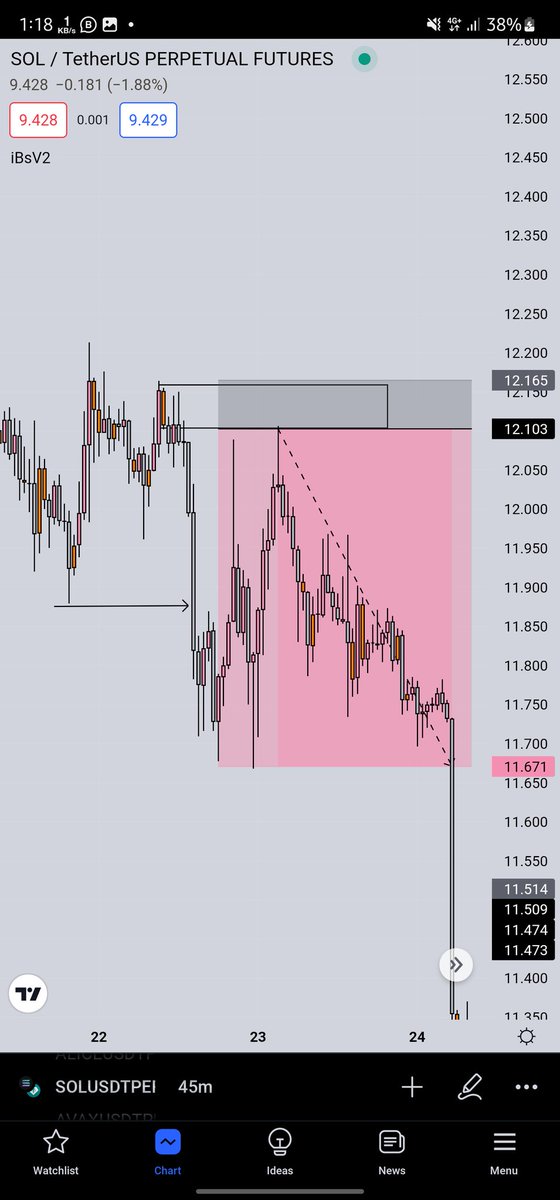
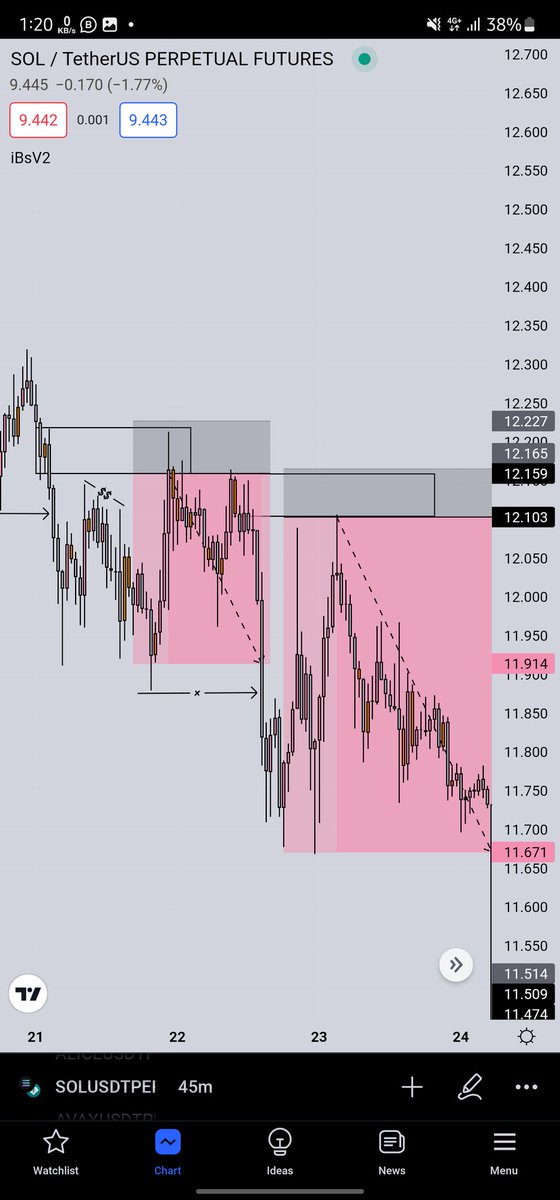
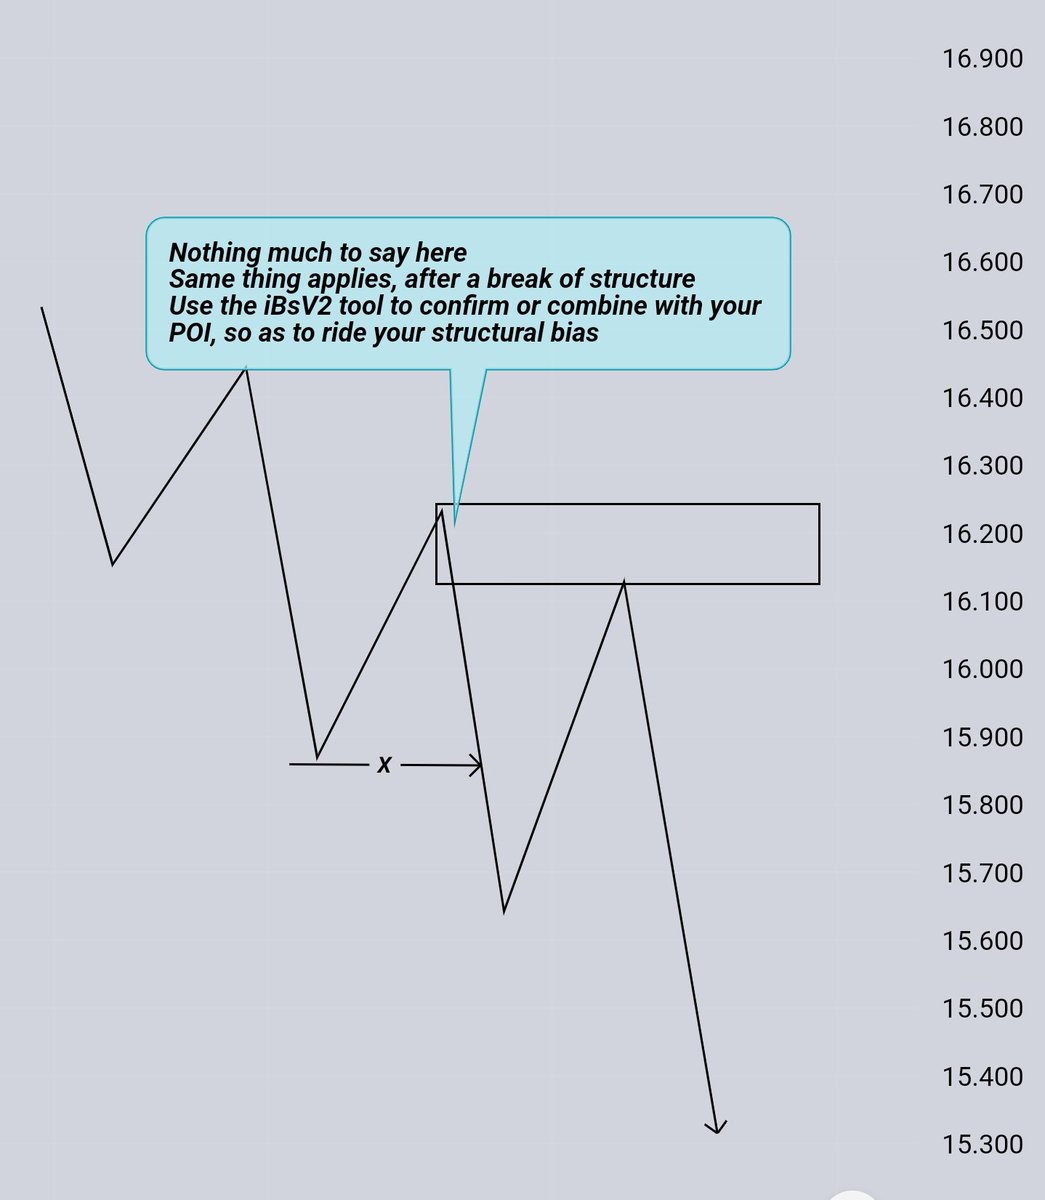
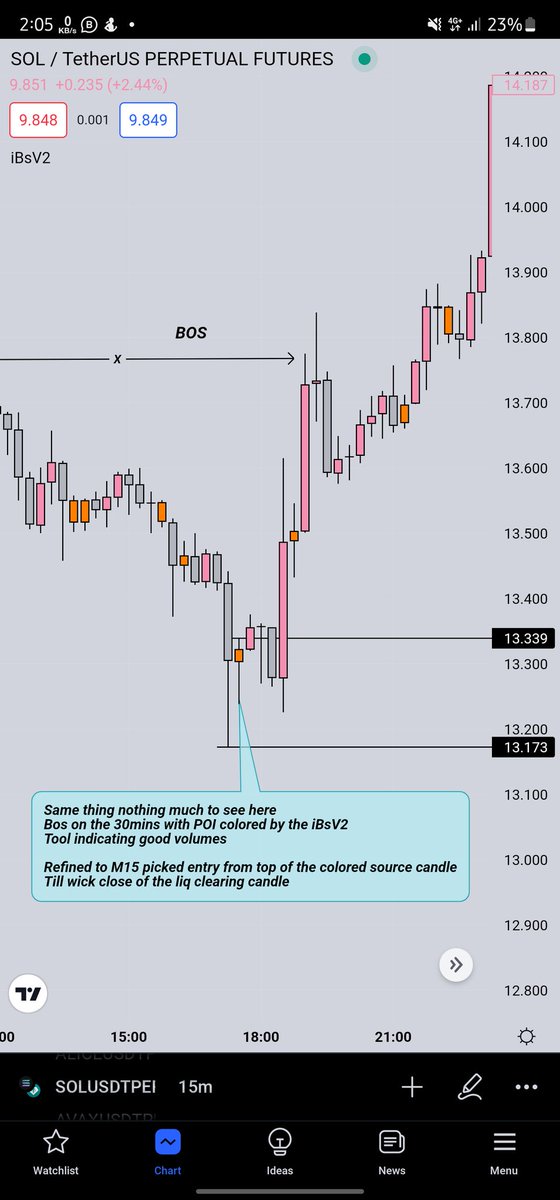
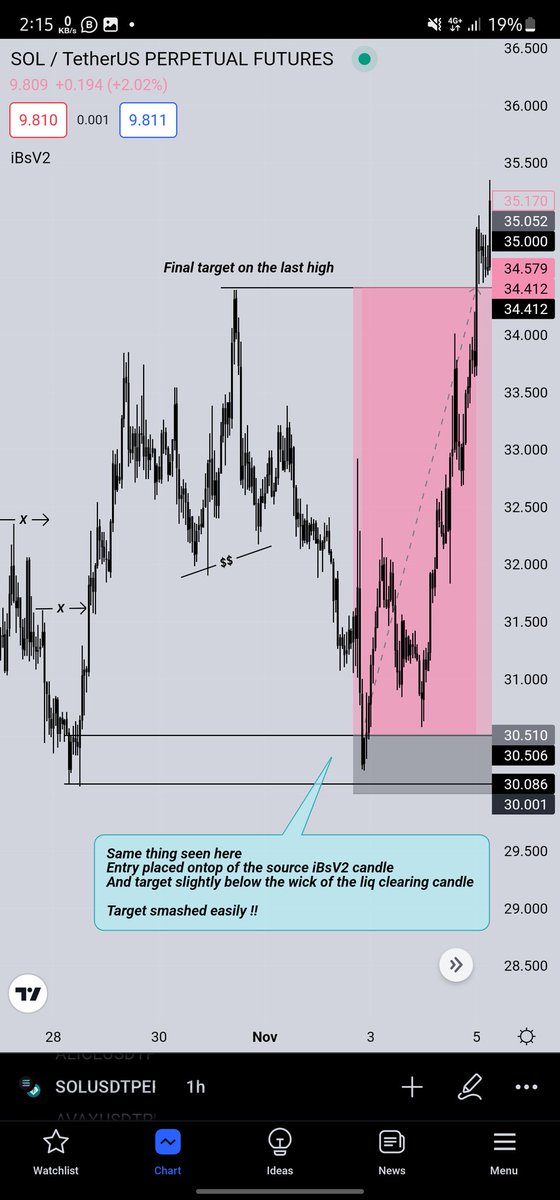
Let's look closely at this illustration below as well
You can clearly see a Break of structure to the downside, liquidity formed and iBsV2 helped confirm specific candles iof high volatile and possible supply orders
Once everything aligns, execution is nothing !!
You can clearly see a Break of structure to the downside, liquidity formed and iBsV2 helped confirm specific candles iof high volatile and possible supply orders
Once everything aligns, execution is nothing !!
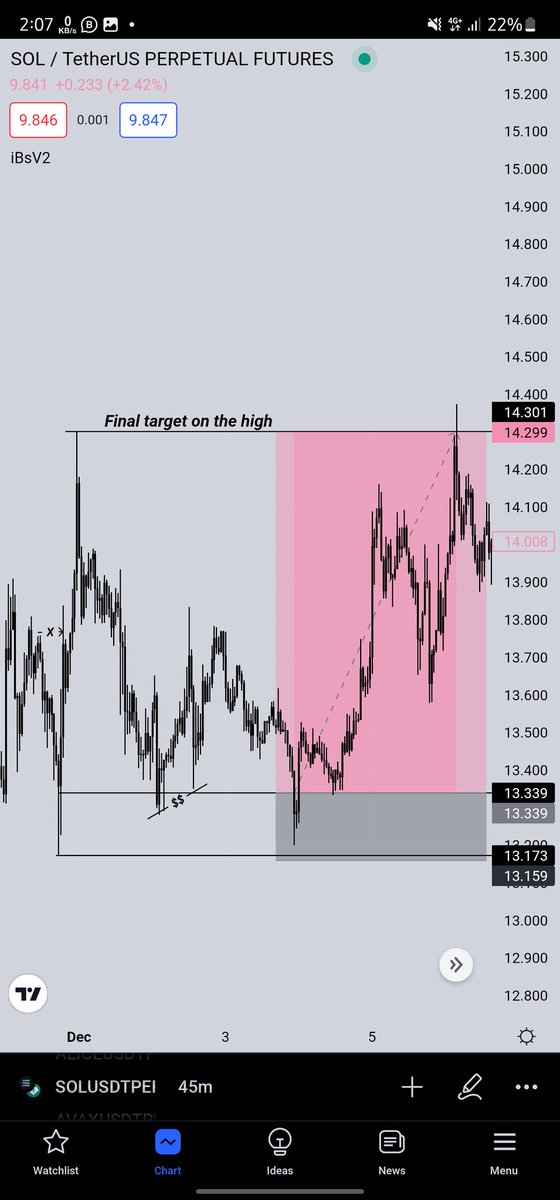
Looks like I've been illustrating more on downtrend
How about "Uptrends" you might second guess ?
Well as you know we're in a BEAR Market and we barely have uptrend but anyways
I still found some little illustration using uptrend that can guide you trade aright !!
Follow me⬇️
How about "Uptrends" you might second guess ?
Well as you know we're in a BEAR Market and we barely have uptrend but anyways
I still found some little illustration using uptrend that can guide you trade aright !!
Follow me⬇️
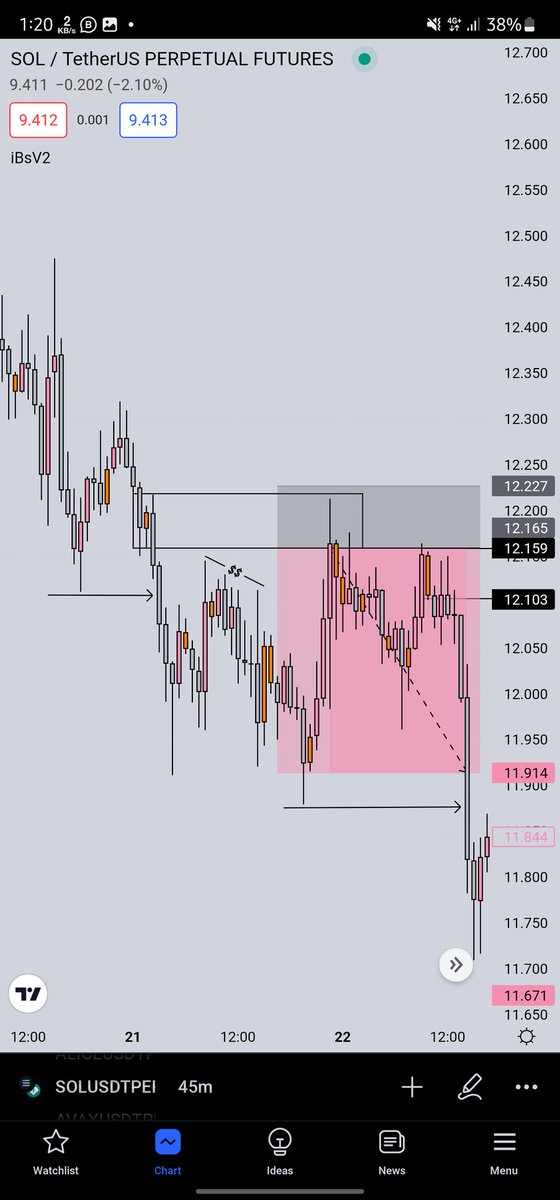
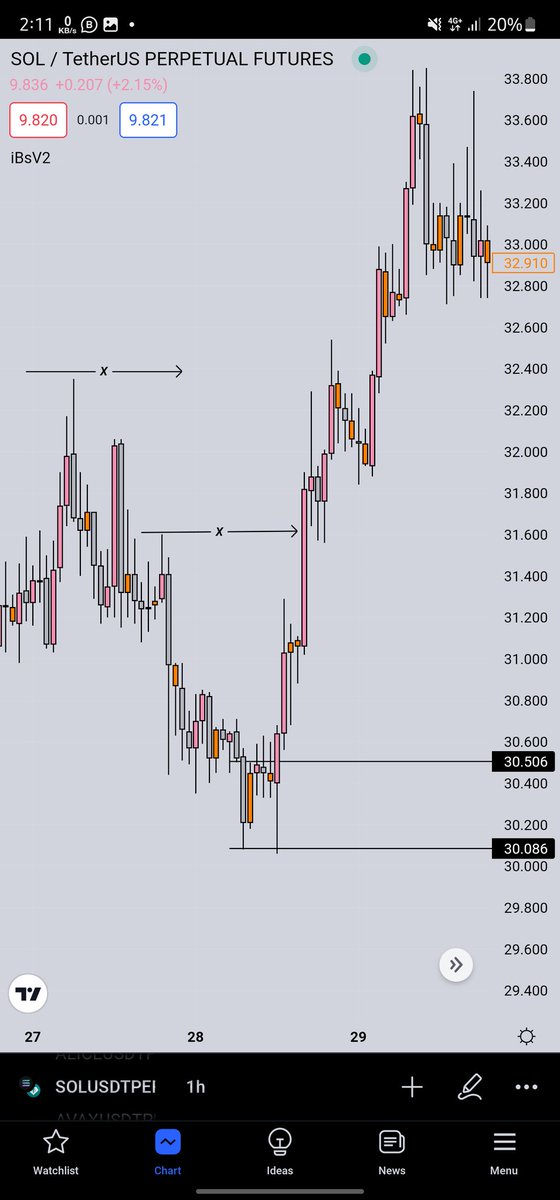
More below !!
And another Below 😄😄
The list doesn't end fr, I can send you a thousand plus illustrations, cuz it just gets easier as you use them in combination with your POI
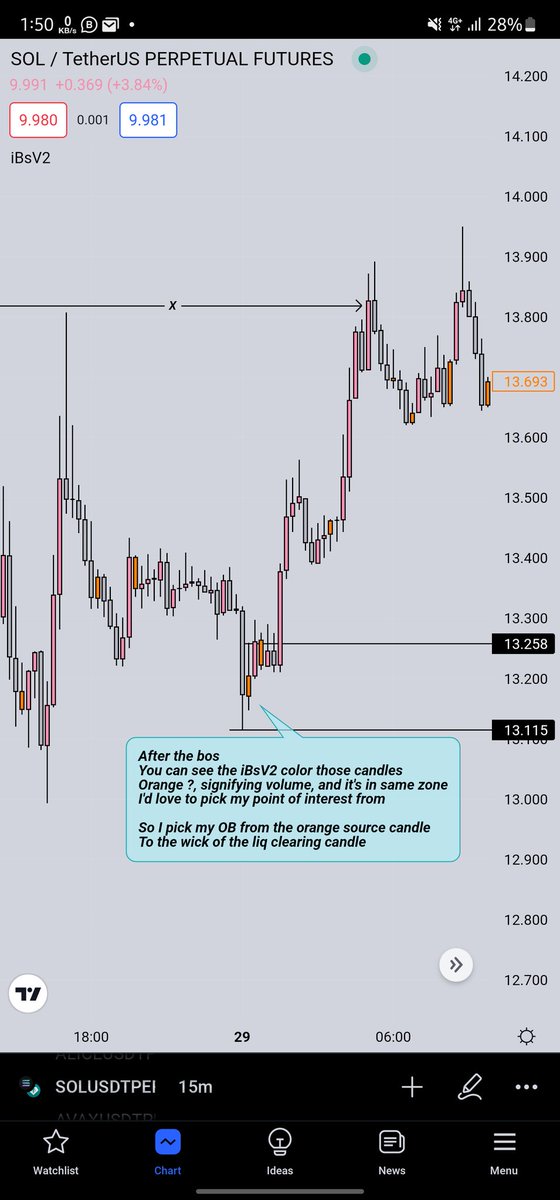
A source candle : is the particular candle you consider as your POI when marking out an Orderblock
The list doesn't end fr, I can send you a thousand plus illustrations, cuz it just gets easier as you use them in combination with your POI
A source candle : is the particular candle you consider as your POI when marking out an Orderblock
Anyways that'll be all for now
So tell me, which other indicators do you use and has worked for you ? maybe I'd backtest it out on my end and give you a thanks later
And remember this is in No financial advice to traders
Only use the indicators at your own risk
Backtest it.
So tell me, which other indicators do you use and has worked for you ? maybe I'd backtest it out on my end and give you a thanks later
And remember this is in No financial advice to traders
Only use the indicators at your own risk
Backtest it.
Also don't fail to like and retweet so your other CT friends get to see this awesome thread first hand from you
And don't forget to follow me @Techriztm for more
And also follow the likes of other good traders like @Alh_Myke1 @neehyeehwah @Starr_gael @_InvestorBen @Marresecira
And don't forget to follow me @Techriztm for more
And also follow the likes of other good traders like @Alh_Myke1 @neehyeehwah @Starr_gael @_InvestorBen @Marresecira
Loading suggestions...