

FOOTPRINT OF SMART MONEY OR BIG BOYS 👇👇
What is smart money?
Smart money refers to the capital that institutional investors, central banks, and other professionals or financial institutions control.
Smart money refers to the capital that institutional investors, central banks, and other professionals or financial institutions control.
We can call them gambler also who have extensive knowledge of the activity that they wager on or have insider information that the common public is not able to access.
They are better informed or more experienced or both
They are better informed or more experienced or both
They always want high return and for that they invest on right stock at right time
That's why they are successful or more chances of success
Smart money can also move markets with size and force when it is controlled by central banks.
That's why they are successful or more chances of success
Smart money can also move markets with size and force when it is controlled by central banks.
Now million dollar question is
how to identify them ??🤔🤔🤔
We can identify them by
* Trading volume
* Stock pricing and index options
* Data source and method
how to identify them ??🤔🤔🤔
We can identify them by
* Trading volume
* Stock pricing and index options
* Data source and method
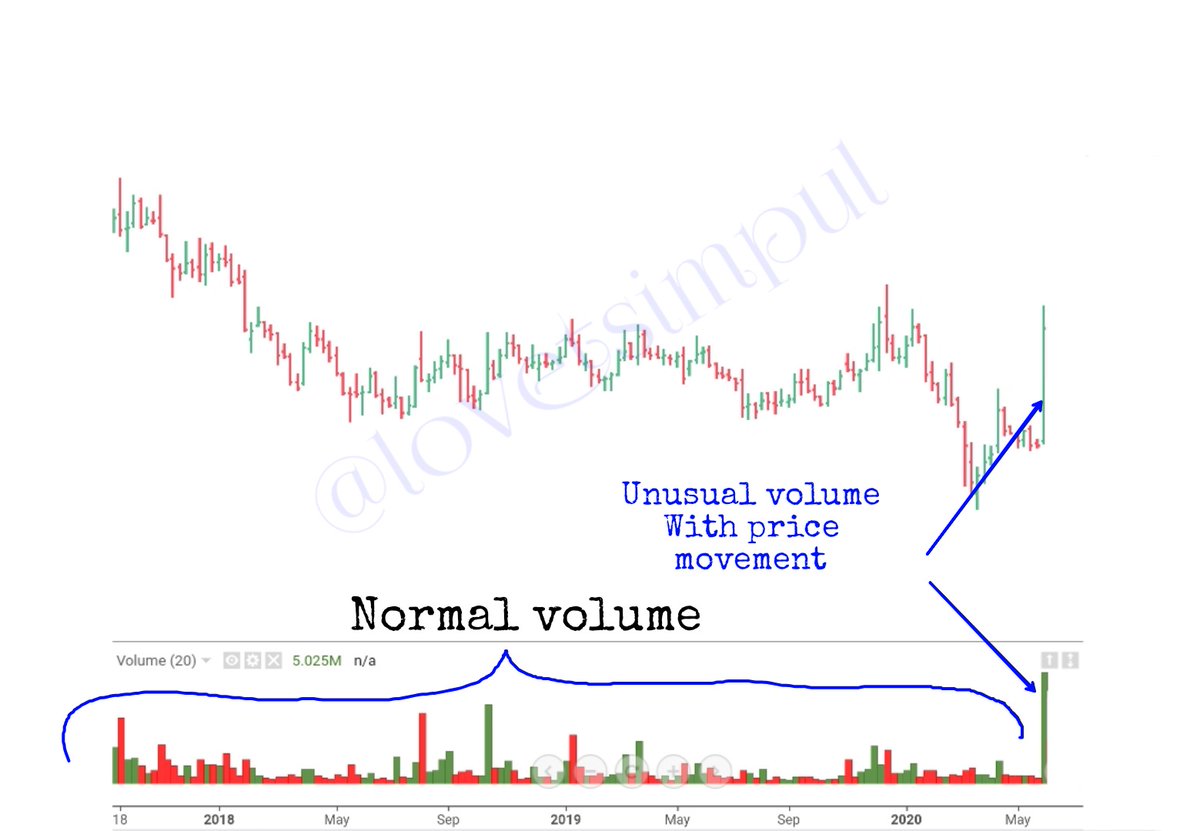
Here will try to understand smart money by trading volume
This is weekly chart of stock
Stock was moving with normal volume since 2+ year
Suddenly one week unusual volume seen.
Stock was moving with normal volume since 2+ year
Suddenly one week unusual volume seen.
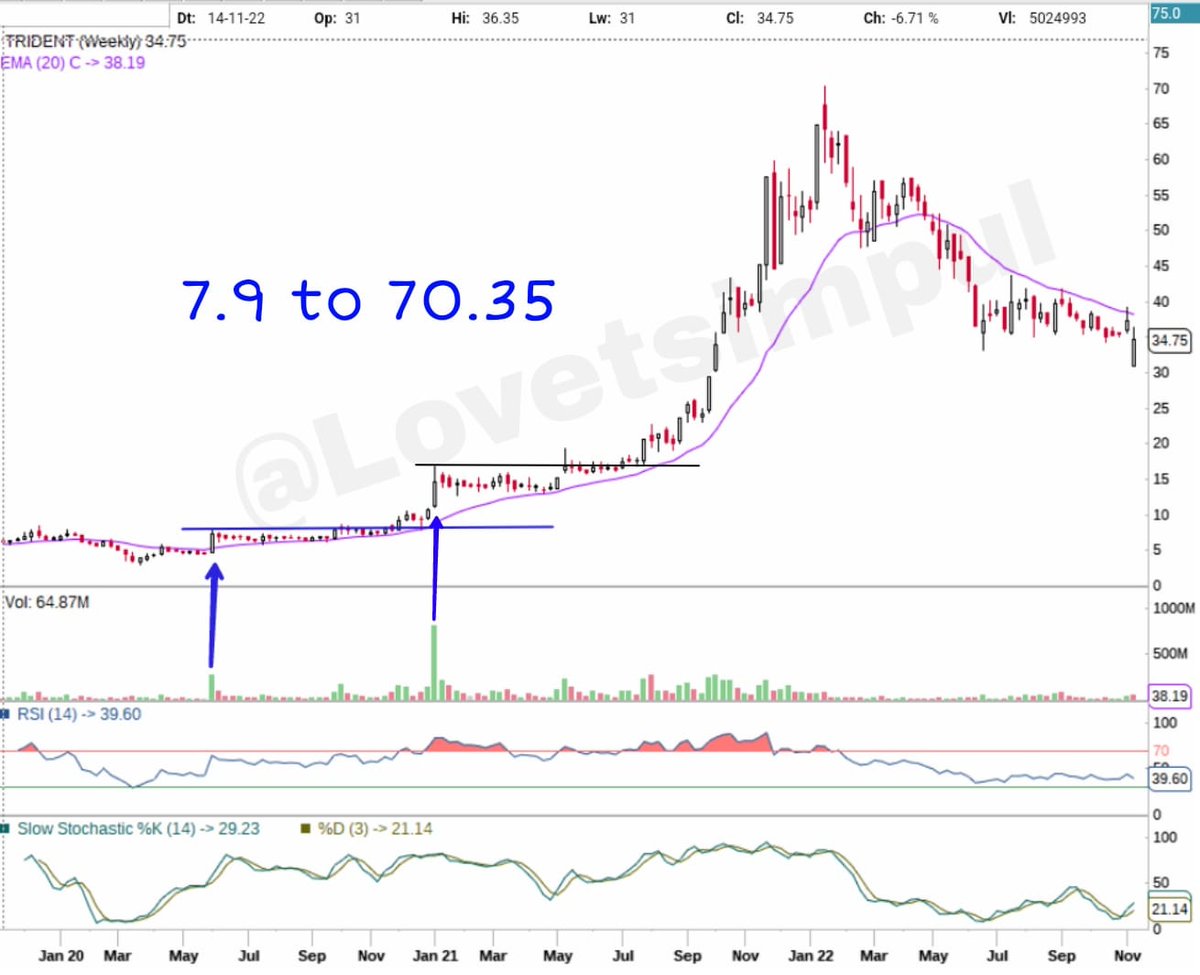
After 3-4 month one more unusual volume had seen in Dec 2020 and that was historically highest volume.
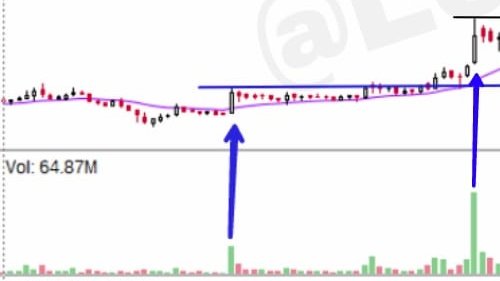
Stock Name is TRIDENT
stock had moved after unusual volume and made high of 70.35
and had given almost 10X return in 1.5 year only.
stock had moved after unusual volume and made high of 70.35
and had given almost 10X return in 1.5 year only.
One more example
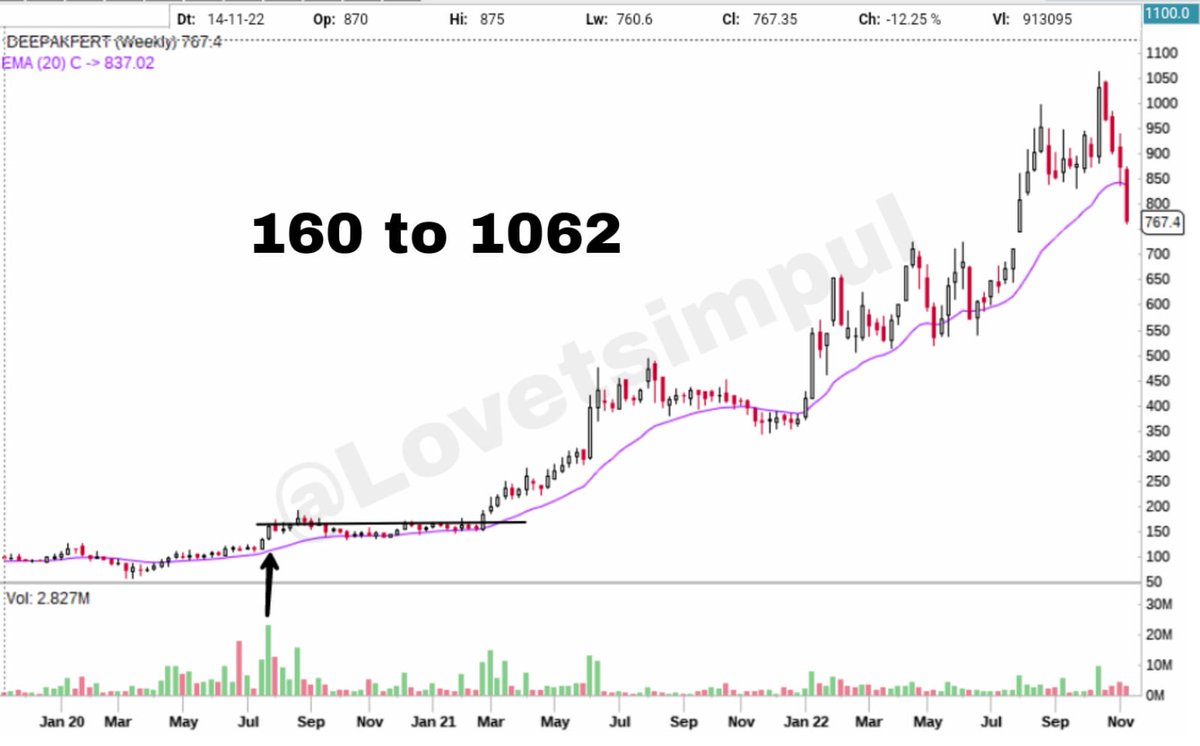
Stock was in down trend (weekly chart )
Unusual volume had seen and stock price was 160
Stock was in down trend (weekly chart )
Unusual volume had seen and stock price was 160
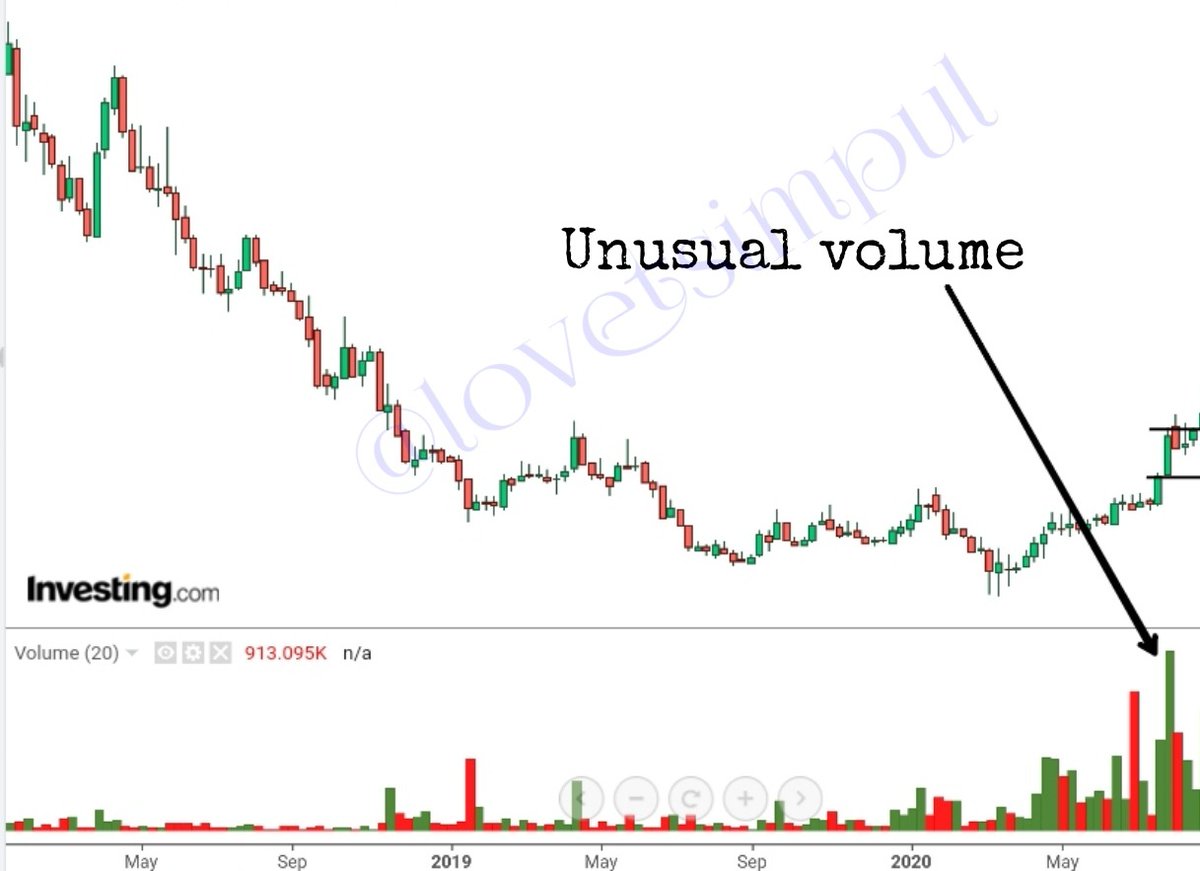
Stock Name is DEEPAKFERT
Stock made high of 1062 after unusual volume.
160 ➡️➡️➡️ 1062
650%+ return in 2.2 year
Stock made high of 1062 after unusual volume.
160 ➡️➡️➡️ 1062
650%+ return in 2.2 year
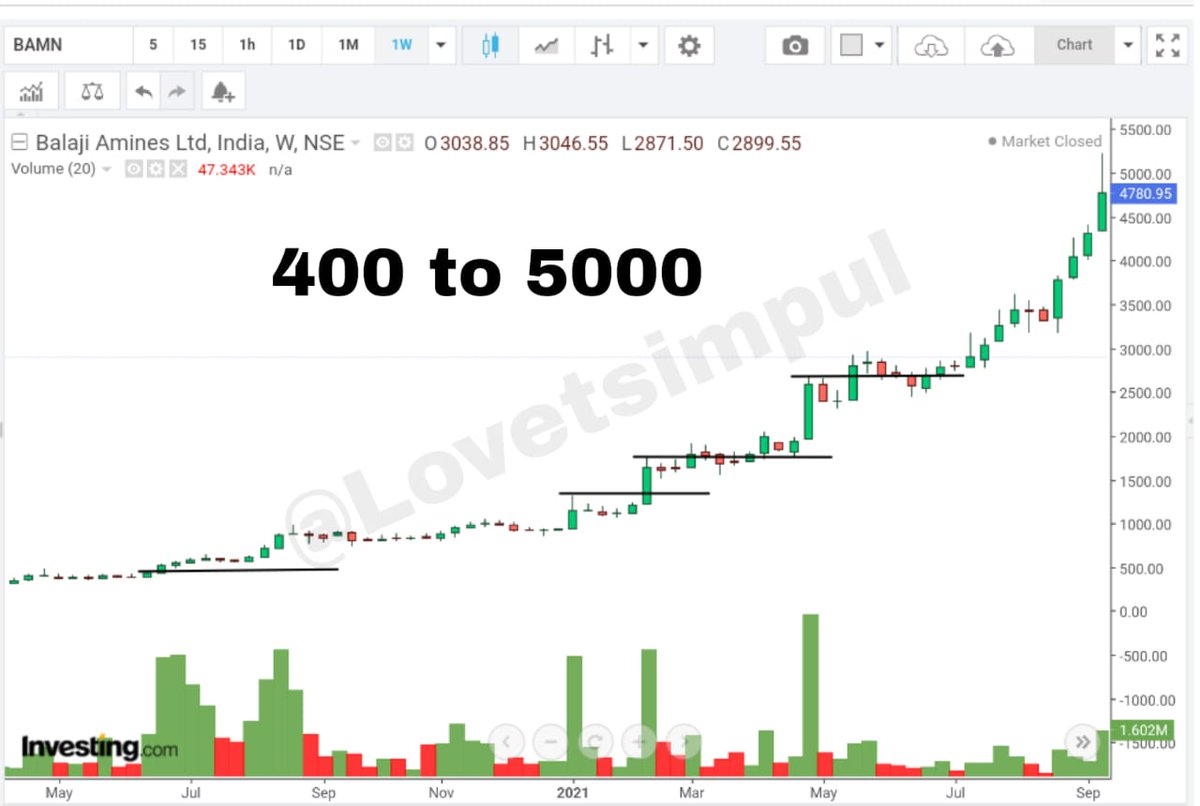
#BALAMINES
400 TO 5000+
400 TO 5000+
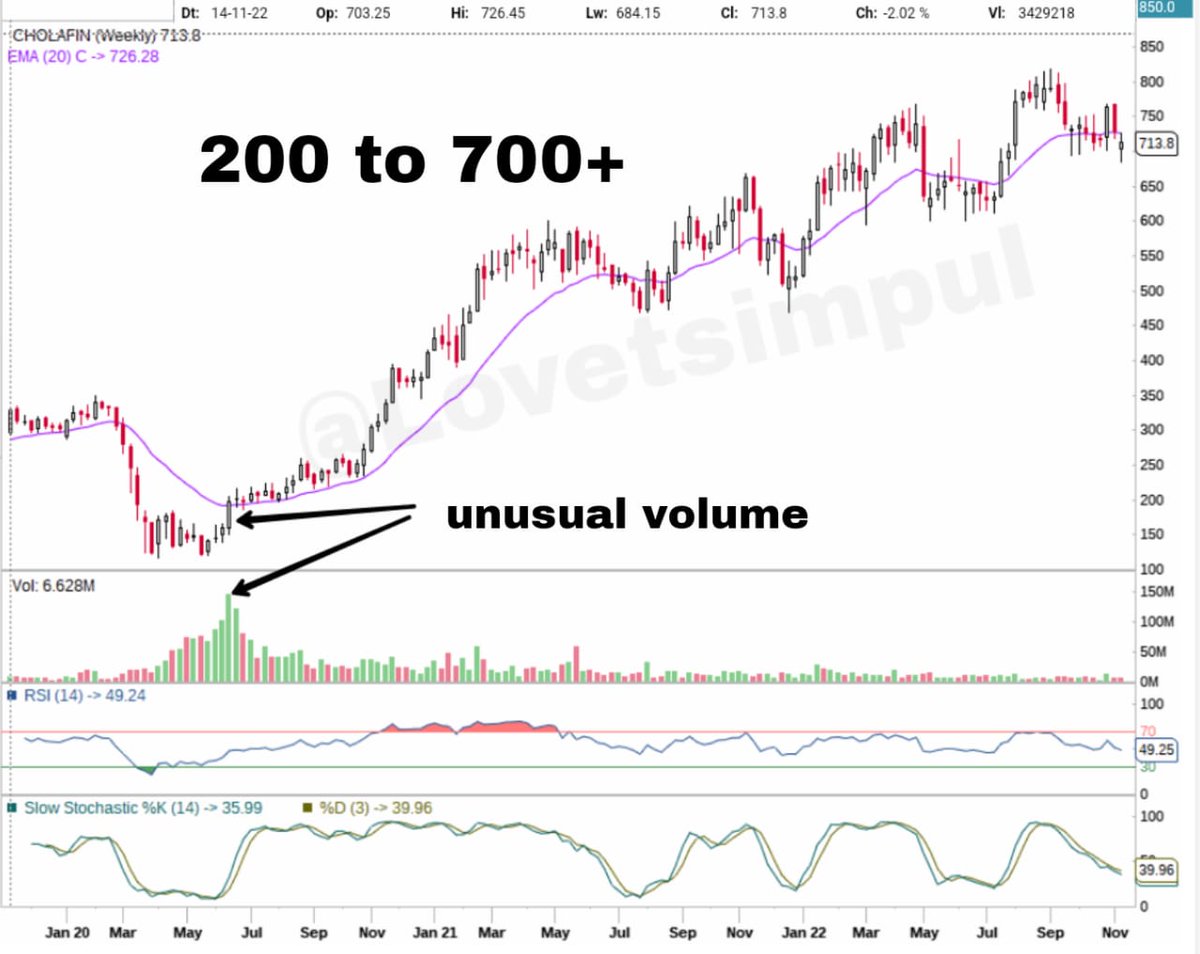
#CHOLAFIN
200 TO 700+
200 TO 700+
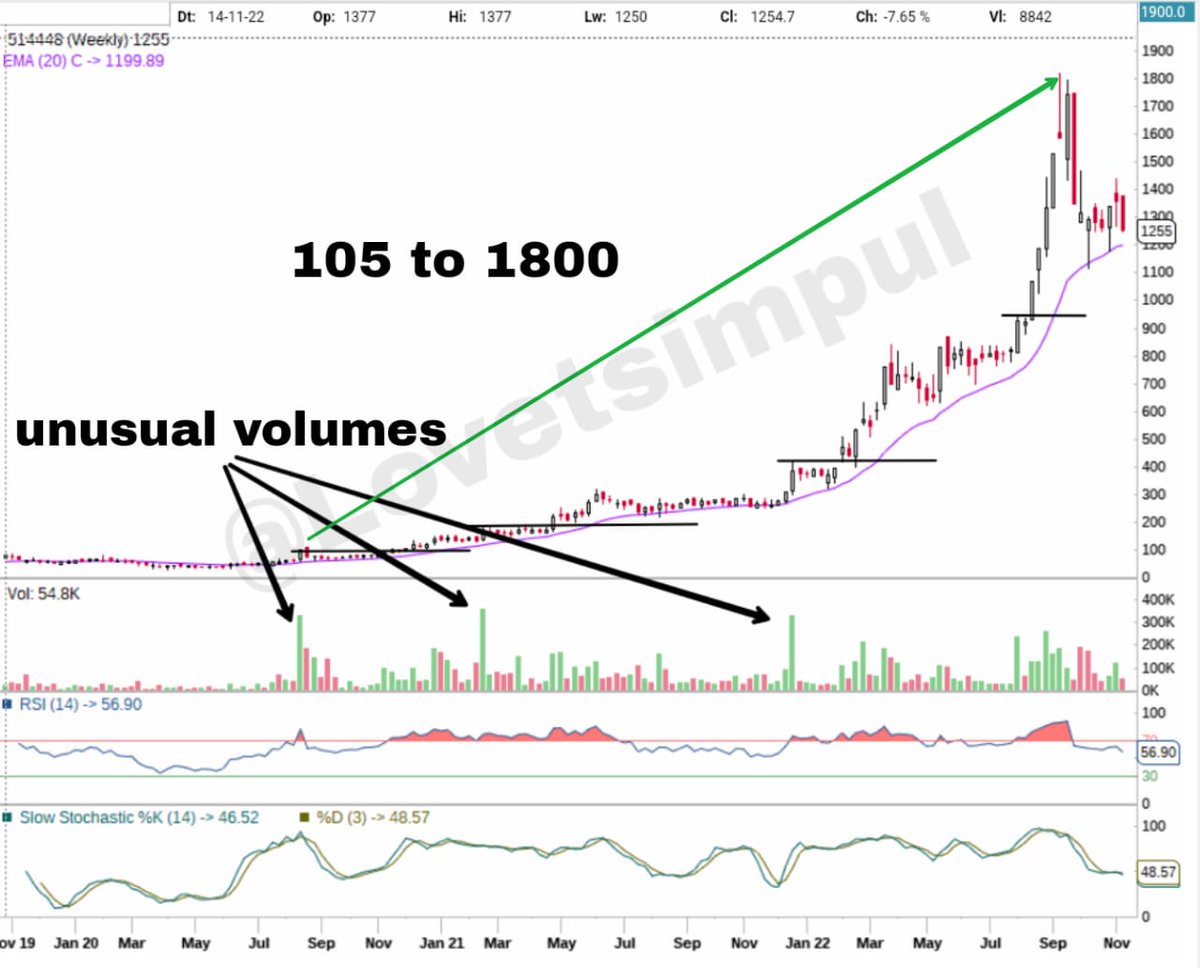
#JYOTIRESINS
105 to 1800+
105 to 1800+
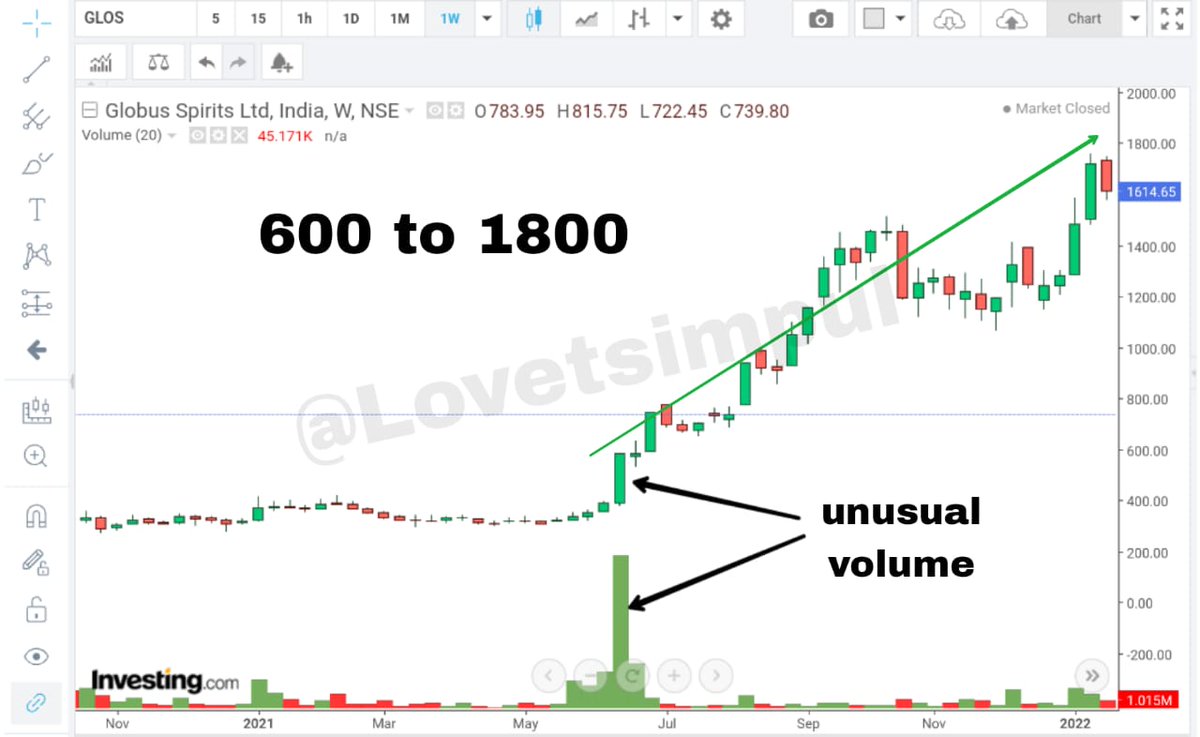
#GLOBUSSPR
600 TO 1800+
600 TO 1800+
#GOLDIAM
30 TO 200+ (FV SPLIT 10 TO 1)
this is intresting case
Stock had not gave any significant move after unusual volume and due to corona stock had came again near that unusual volume zone
No move till 1. 5 year and after that 700% return in one year
30 TO 200+ (FV SPLIT 10 TO 1)
this is intresting case
Stock had not gave any significant move after unusual volume and due to corona stock had came again near that unusual volume zone
No move till 1. 5 year and after that 700% return in one year

Why this unusual volume seen in stocks ?
You see, this smart money don’t invest like you and I do. Remember, they often control billions of money. So when they’re investing in a company, they won’t buy millions of shares all at once.
You see, this smart money don’t invest like you and I do. Remember, they often control billions of money. So when they’re investing in a company, they won’t buy millions of shares all at once.
Instead they’ll “scale in” to a stock over weeks or months.
They do this for two reasons: to prevent the price from spiking, and to hide their actions from others who would front-run them.
They do this for two reasons: to prevent the price from spiking, and to hide their actions from others who would front-run them.
Smart money go to great lengths to hide their tracks. But they can’t hide volume. Huge volume is a telltale sign that smart money and other big institutions are buying a stock. But remember, they want to be discreet. So you’re not going to see a 1,000% volume spike.
Instead, look for noticeable increases. We’re talking 10%, 20%, or 50% above normal trading volume. This sort of rising volume often lets we know that “someone big” is buying the stock.
“someone has been loading up on the company’s shares.”
“someone has been loading up on the company’s shares.”
They’re among the world’s smartest and most sophisticated investors. More important, they control a lot of money. When they concentrate billions on one stock, that stock will often shoot to the moon.
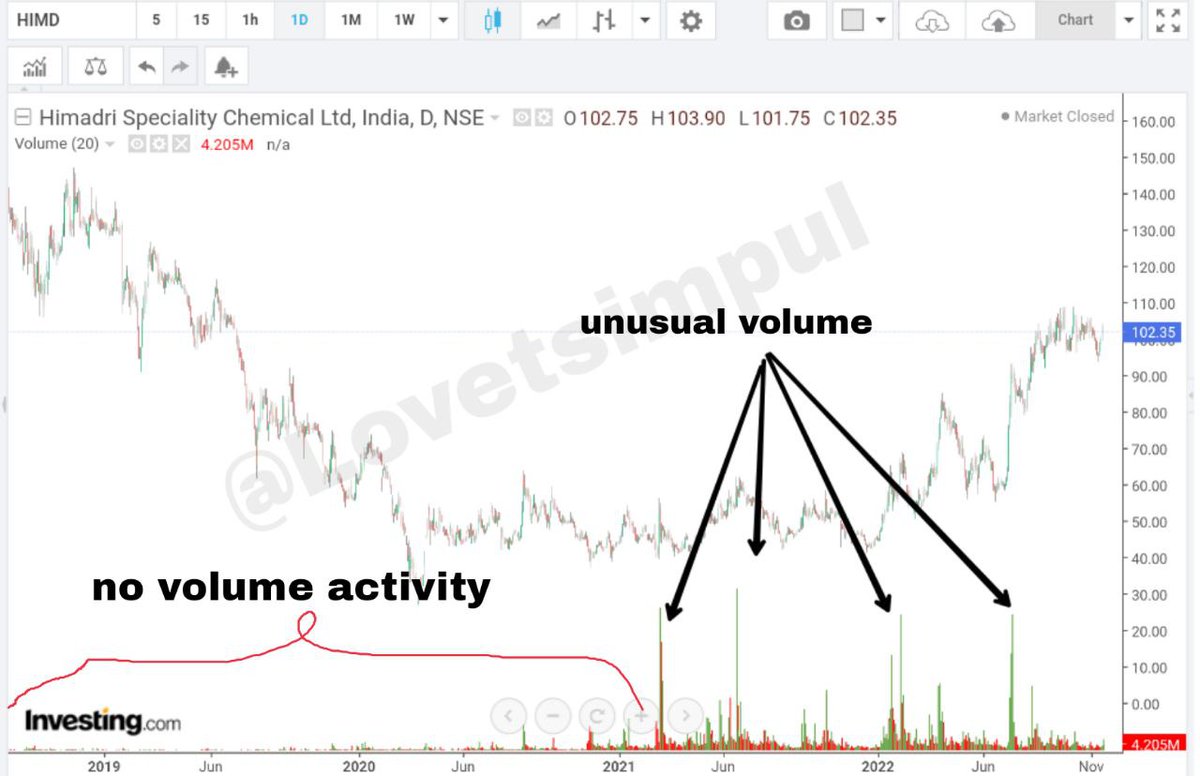
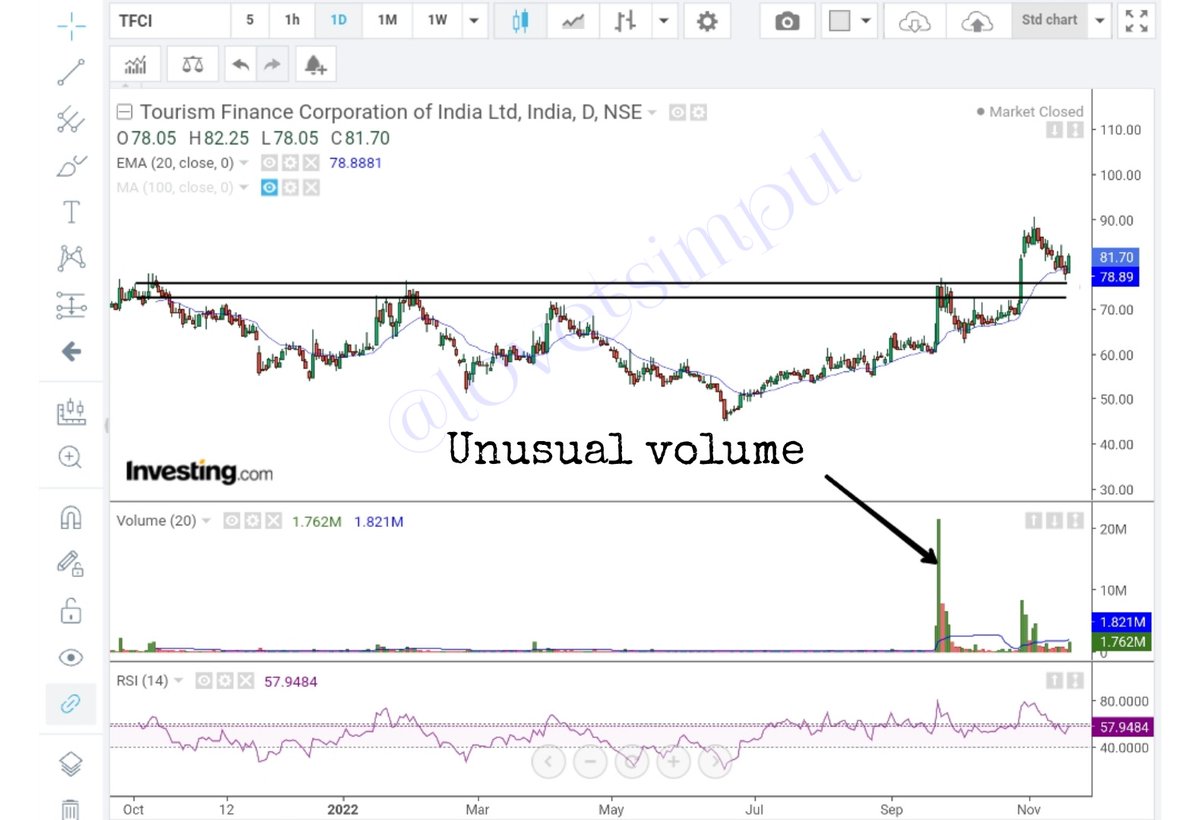
Look at HSCL daily chart
Before 2021 no unusual volume activity was observed
Then after 4-5 unusual volume was seen in next 1.5 year
Someone added in this period.
And stock moved from 40 to 100+
I will not surprised if this touch ATH in coming months
Before 2021 no unusual volume activity was observed
Then after 4-5 unusual volume was seen in next 1.5 year
Someone added in this period.
And stock moved from 40 to 100+
I will not surprised if this touch ATH in coming months
As we may know, big hedge funds are required to disclose the stocks they’re buying and selling on a quarterly basis.
Problem is, by the time they released their buying selling data, the information in it is “stale.” It tells you what they did in the last three months. To profit from this information, we need to know what they are buying now.
And this we can identify by unusual volume activity.
Recently unusual volume seen in one stock which is shared during market hour in our telegram channel also
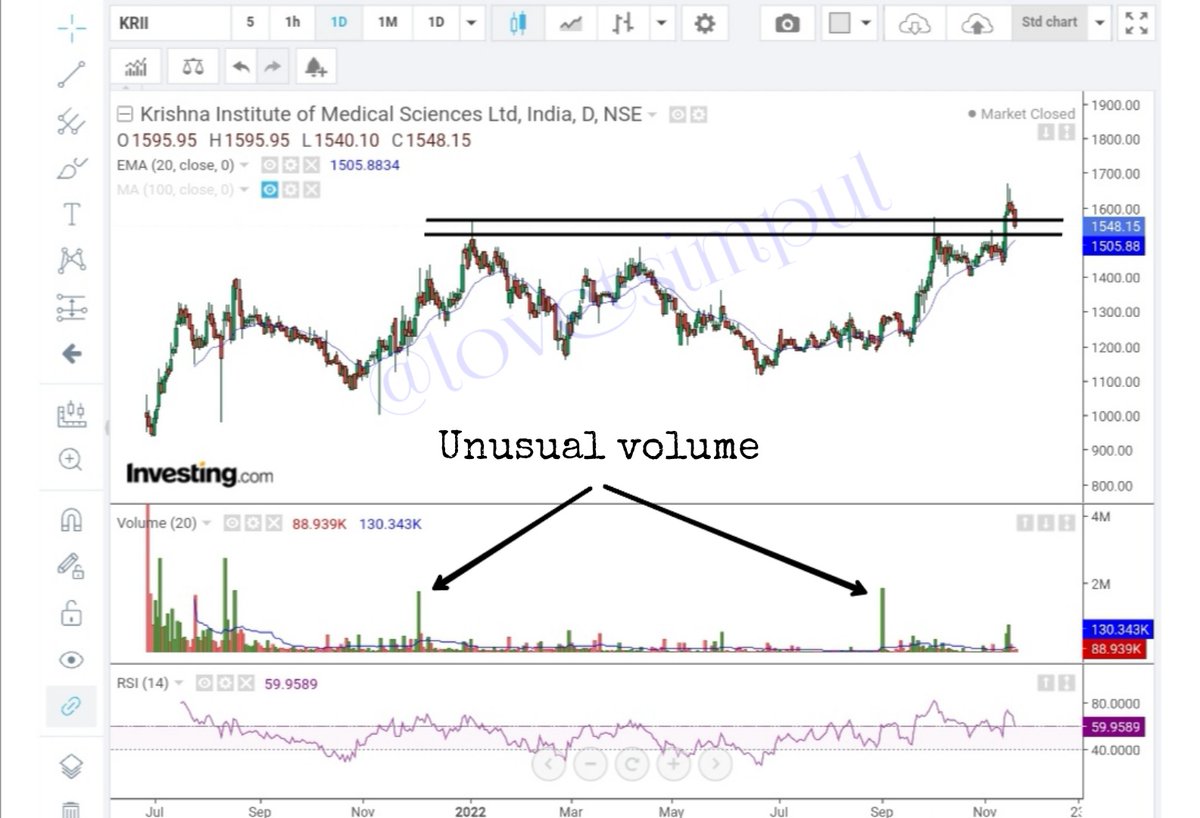
Stock name is KIMS
Recently unusual volume seen in one stock which is shared during market hour in our telegram channel also
Stock name is KIMS
#KIMS
we can see there are 3-4 unusual volume
After last unusual volume stick hit New ATH
I think this momentum will continue.
D- invested
we can see there are 3-4 unusual volume
After last unusual volume stick hit New ATH
I think this momentum will continue.
D- invested
One more fresh example
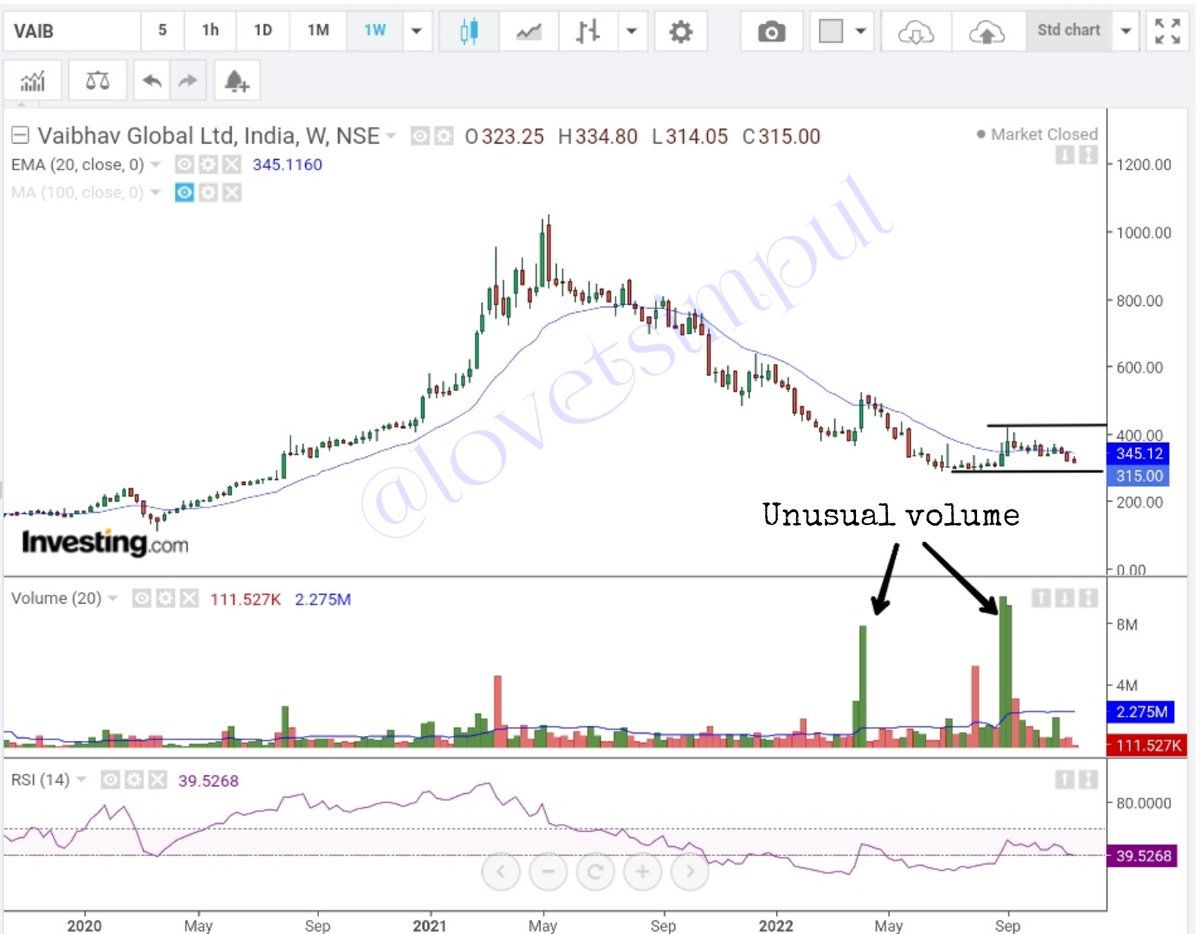
#VAIBHAVGBL (weekly chart)
Stock correct from 1000+ to 300
And now we can see some unusual volume on Weekly chart.
Someone has been loading up on the share
#VAIBHAVGBL (weekly chart)
Stock correct from 1000+ to 300
And now we can see some unusual volume on Weekly chart.
Someone has been loading up on the share
I have shared what I learned and understood
I don't know whether I am right or wrong
But this is beneficial for me
Personally captured moves in
#GOLDIAM 211 TO 1000+( BEFORE SPLIT)
#GLOBUSSPR (350 TO 1200+)
#DEEPAKFEET (155 TO 500+)
#TRIDENT (16 TO 60+)
All shared in channel
I don't know whether I am right or wrong
But this is beneficial for me
Personally captured moves in
#GOLDIAM 211 TO 1000+( BEFORE SPLIT)
#GLOBUSSPR (350 TO 1200+)
#DEEPAKFEET (155 TO 500+)
#TRIDENT (16 TO 60+)
All shared in channel
If you feel this is useful and good learning stuff then pl like and retweet first tweet.
so, that other people also can learn.
Thanks.
so, that other people also can learn.
Thanks.
I have shared what I learned and understood
I may be wrong
But this is beneficial for me
Personally captured moves in
#GOLDIAM 211 TO 1000+( BEFORE SPLIT)
#GLOBUSSPR (350 TO 1200+)
#DEEPAKFEET (155 TO 500+)
#TRIDENT (16 TO 60+)
All shared in telegram channel
I may be wrong
But this is beneficial for me
Personally captured moves in
#GOLDIAM 211 TO 1000+( BEFORE SPLIT)
#GLOBUSSPR (350 TO 1200+)
#DEEPAKFEET (155 TO 500+)
#TRIDENT (16 TO 60+)
All shared in telegram channel
If you feel this is useful and good learning stuff then pl like and retweet first tweet.
so, that other also can learn.
Thanks.
so, that other also can learn.
Thanks.
Loading suggestions...