

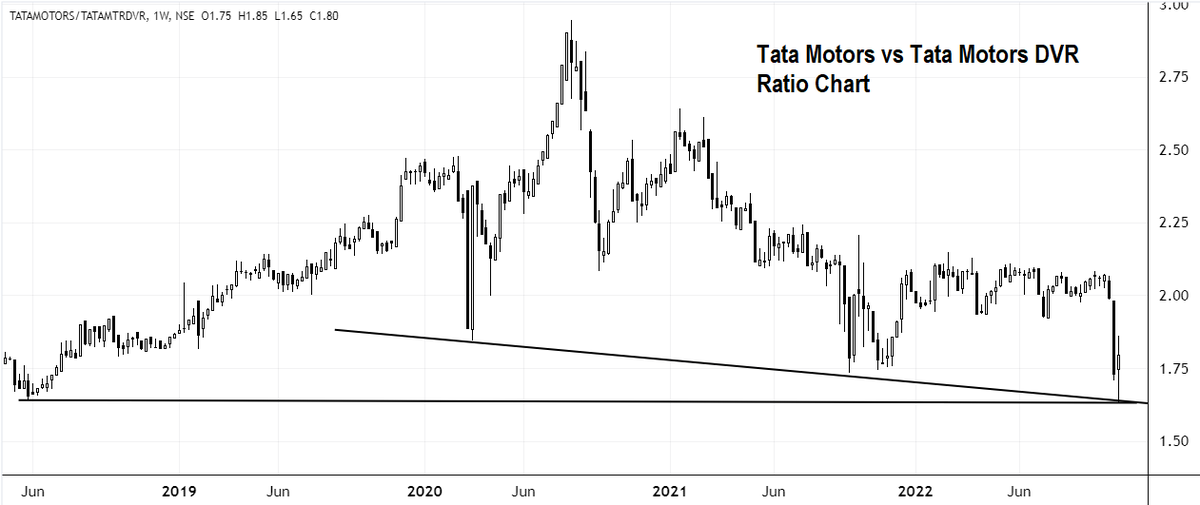
#TataMotors vs #TataMotorsDVR Ratio Charts speaks everything
Understanding of #RatioChart will help you analyze which is undervalued / overvalued.
Read this 🧵to Understand About Ratio Charts 👇
@KommawarSwapnil @caniravkaria @VVVStockAnalyst @SumitResearch (Views Invited)
Understanding of #RatioChart will help you analyze which is undervalued / overvalued.
Read this 🧵to Understand About Ratio Charts 👇
@KommawarSwapnil @caniravkaria @VVVStockAnalyst @SumitResearch (Views Invited)
1⃣
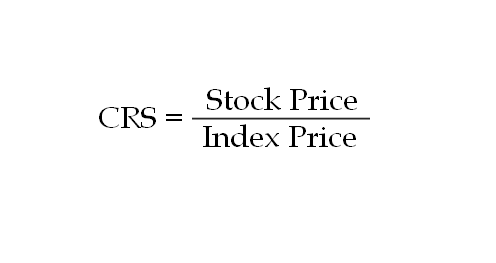
A #RatioChart (Comparative Relative Strength) compares two securities, or a security and an index, to show relative performance to each other. Such a chart is prepared by dividing price of one security by price of a second security or an index.
A #RatioChart (Comparative Relative Strength) compares two securities, or a security and an index, to show relative performance to each other. Such a chart is prepared by dividing price of one security by price of a second security or an index.
2⃣
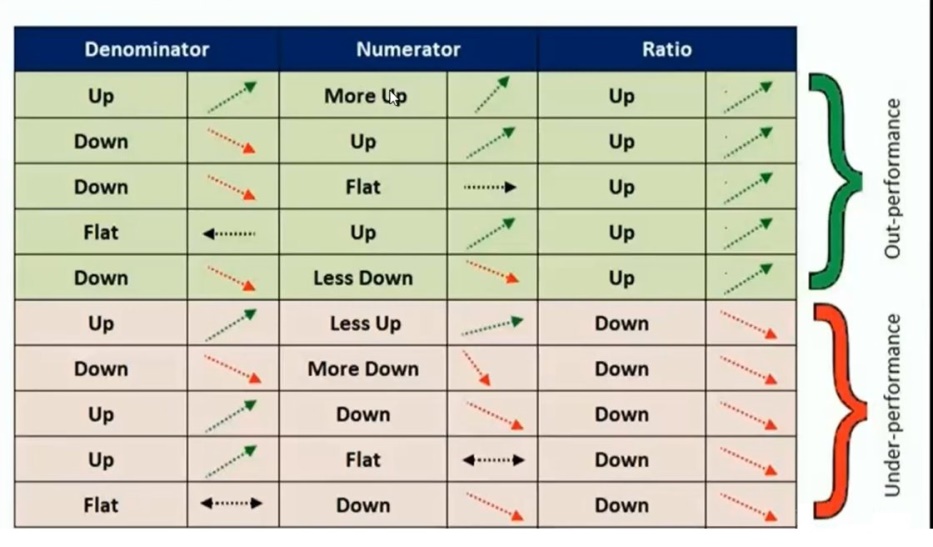
If in #RatioChart, ratio line is rising, it means numerator is outperforming denominator and if ratio line is falling, it means numerator is underperforming denominator.
If ratio line is flat then it can be said that movement of numerator is similar to that on denominator.
If in #RatioChart, ratio line is rising, it means numerator is outperforming denominator and if ratio line is falling, it means numerator is underperforming denominator.
If ratio line is flat then it can be said that movement of numerator is similar to that on denominator.
3⃣
Keep in mind that Ratio charts does not say anything about the absolute direction of price, but only talks about the relative direction.
#TechnicalAnalysis #RelativeStrength #RS #Trading
Keep in mind that Ratio charts does not say anything about the absolute direction of price, but only talks about the relative direction.
#TechnicalAnalysis #RelativeStrength #RS #Trading
4⃣
Some Ways to use Ratio Charts -
Stock vs Stock (Infosys vs TCS)
Stock vs Sector (Infosys vs IT Index)
Stock vs Market (Reliance vs Nifty)
Sector vs Sector (Banking vs IT)
Sector vs Market (Pharma vs Nifty)
Market vs Market (Nifty vs S&P 500)
Asset vs Asset (Gold vs Nifty)
Some Ways to use Ratio Charts -
Stock vs Stock (Infosys vs TCS)
Stock vs Sector (Infosys vs IT Index)
Stock vs Market (Reliance vs Nifty)
Sector vs Sector (Banking vs IT)
Sector vs Market (Pharma vs Nifty)
Market vs Market (Nifty vs S&P 500)
Asset vs Asset (Gold vs Nifty)
5⃣
To know more about #RatioCharts and how to use them in your analysis, people can read this book -
amzn.to
To know more about #RatioCharts and how to use them in your analysis, people can read this book -
amzn.to
Loading suggestions...