

Why am I saying this, the explanation 🧵

The simplest way to check this is our common Bollinger Bands. 20 periods with 2 SD which generally contains 95% of all price action.
So if we increase the deviations to 3, that should contain 99.7% of all observations, a "near certainty"
So if we increase the deviations to 3, that should contain 99.7% of all observations, a "near certainty"
Now look at the Nifty fut charts with 3 SD band. Also look at the 20sma ( the mean) which is negatively/downwards sloping. Nifty trading at/outside 3sd levels with a negatively sloping mean, is very difficult to sustain IMHO
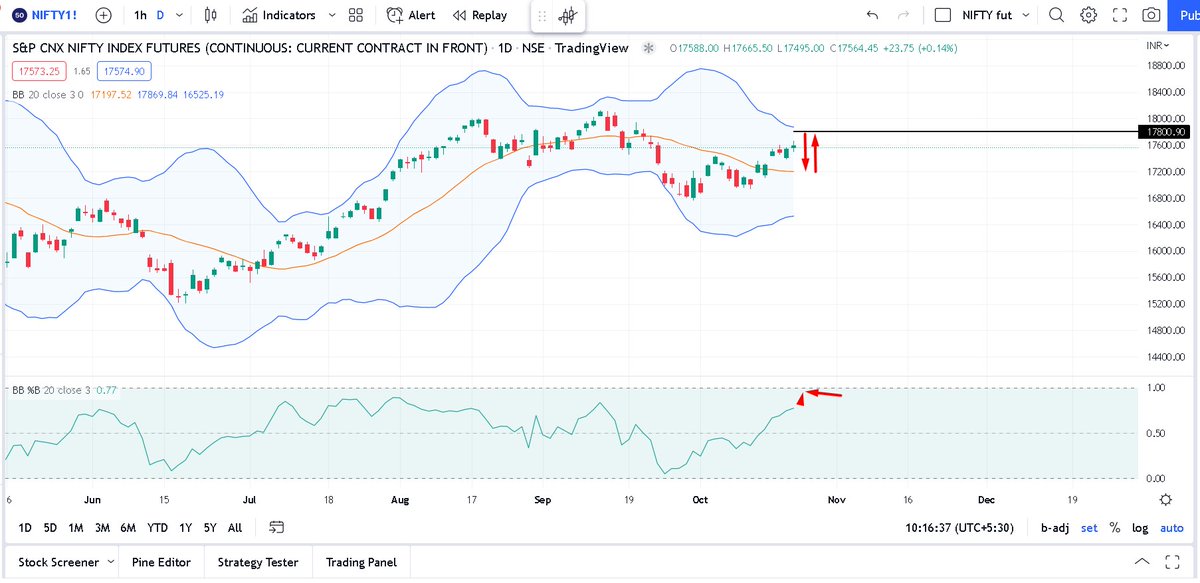
The indicator on bottom pane is %B with 3SD. It shows where the close is relative to the bands. It will hit max value above 17800. So buying here is not justified, better to wait for a correction or some sideways moves to be safe.
Close below 17440 will be a sell signal
Close below 17440 will be a sell signal
Loading suggestions...