

After opening a new chart we want to:
1) Map out key levels on high timeframes
2) Identify trend and stage of trend
3) Identify high timeframe accumulation/distribution with additional indicators
4) Make a trading plan based on your trading style
1) Map out key levels on high timeframes
2) Identify trend and stage of trend
3) Identify high timeframe accumulation/distribution with additional indicators
4) Make a trading plan based on your trading style
Example: $SOL
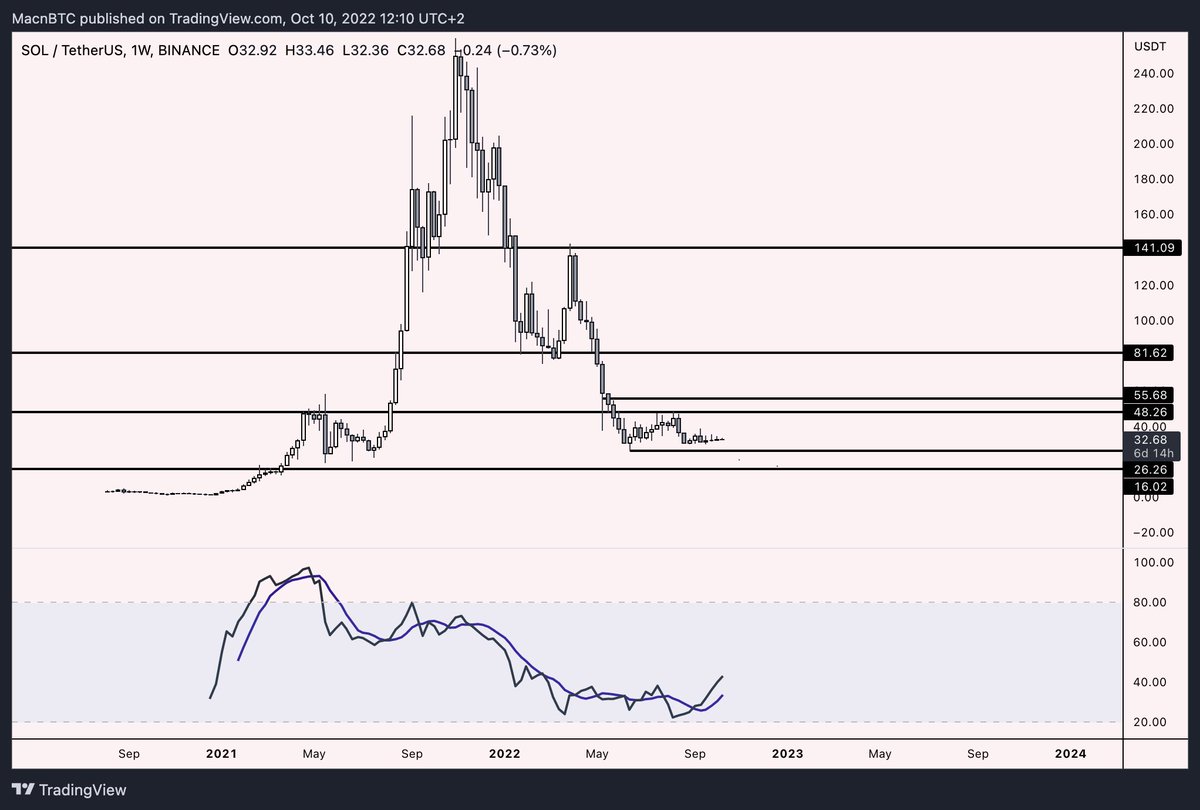
1) Mapping out key levels on high timeframes.
After opening a fresh chart I like to have no indicators on and go on a high timeframe. The first thing we are going to do is identify key levels on the highest possible timeframes (monthly/weekly/3D)
1) Mapping out key levels on high timeframes.
After opening a fresh chart I like to have no indicators on and go on a high timeframe. The first thing we are going to do is identify key levels on the highest possible timeframes (monthly/weekly/3D)
If you still haven’t read my guide on how to map out key levels and identify trends please do so here:
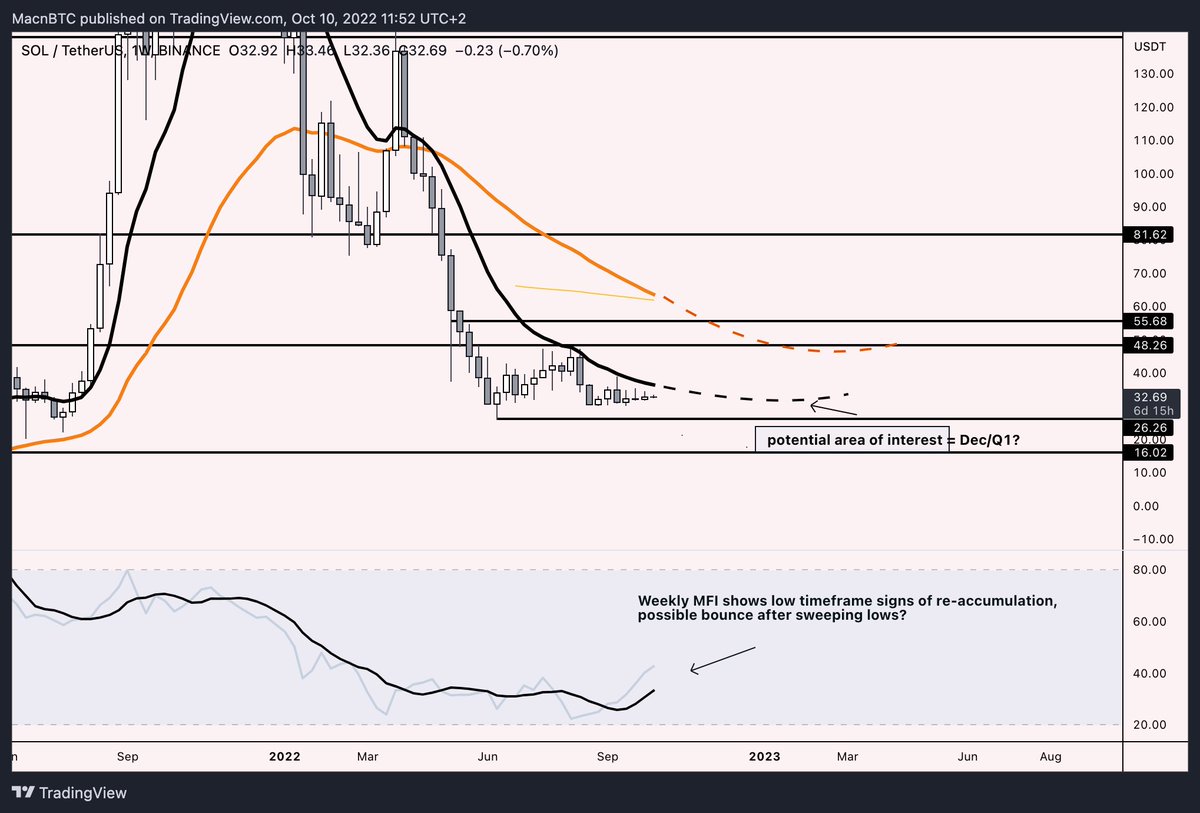
We can already see that the asset is in a downtrend. But let’s turn on some MAs to determine the stage of the downtrend and potential reversal period
We can already see that the asset is in a downtrend. But let’s turn on some MAs to determine the stage of the downtrend and potential reversal period
2) Determining trend and stage of the trend
Obviously SOL is in a downtrend, we can clearly see that the key MAs won’t be flat for a while and current price action is in the middle range of the support and resistance we marked
Obviously SOL is in a downtrend, we can clearly see that the key MAs won’t be flat for a while and current price action is in the middle range of the support and resistance we marked

3) By using indicators such as MFI on Weekly and Monthly we can try to spot possible accumulation.
Let’s zoom in, mark out more levels (I like to map out VWAPs at this stage, guide soon)
Notice how Weekly MFI started curling up (still no bull divs though)
Let’s zoom in, mark out more levels (I like to map out VWAPs at this stage, guide soon)
Notice how Weekly MFI started curling up (still no bull divs though)
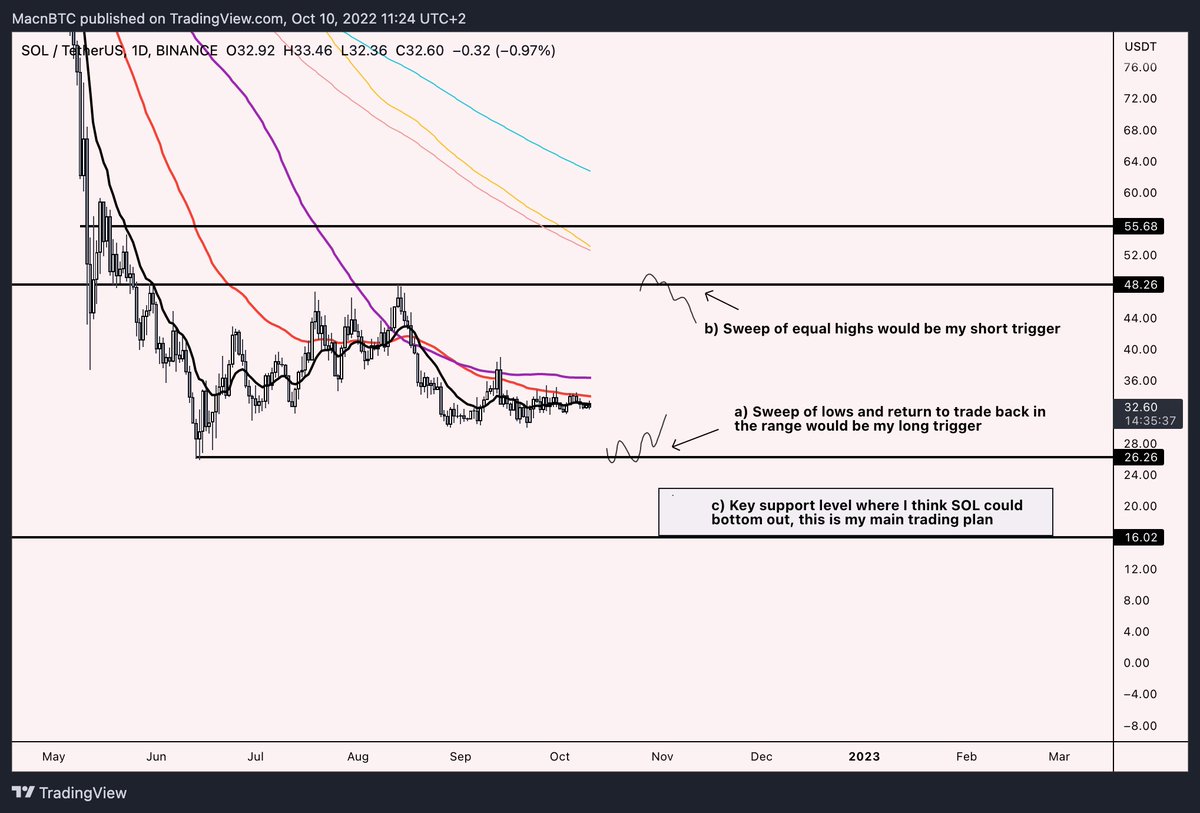
4) Time to make a plan based on our trading strategy.
Here is an example of how mine would look like.
aiming for plan c) setting alerts at $16-$20 and walking away.
Patience
Here is an example of how mine would look like.
aiming for plan c) setting alerts at $16-$20 and walking away.
Patience
Next guide will teach you how you can scroll over 100 charts in a matter of minutes using a maximum of few seconds per chart to pick the ones that look the most appealing to trade


Loading suggestions...