

7 Excel Quick Analysis (QA) that analyze your data, so you don't have to:
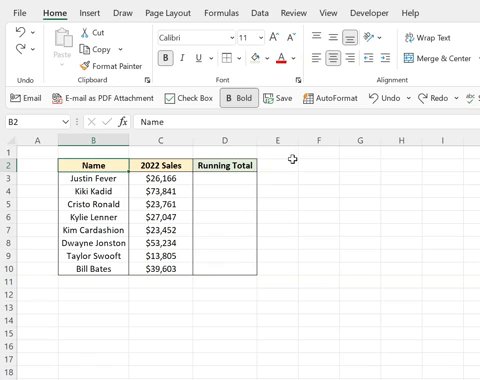
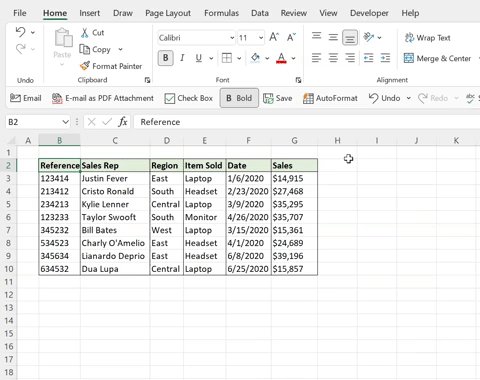
1. Running Total
Calculating data metrics like running total can be tricky, but not with QA. Select the data you want to calculate > QA > Totals tab > Running Total. As you can see, Excel auto-calculated the running total and even inserted all the formulas for us!
Calculating data metrics like running total can be tricky, but not with QA. Select the data you want to calculate > QA > Totals tab > Running Total. As you can see, Excel auto-calculated the running total and even inserted all the formulas for us!
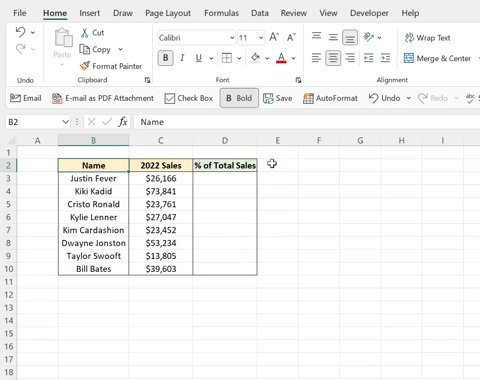
2. % Total
Now that we know how to calculate the running total with QA, let’s learn how to calculate % of the total. Select the data you want to calculate > QA > Totals tab > % Total. Once again, Excel auto-calculated % of the total for each value and inserted all the formulas!
Now that we know how to calculate the running total with QA, let’s learn how to calculate % of the total. Select the data you want to calculate > QA > Totals tab > % Total. Once again, Excel auto-calculated % of the total for each value and inserted all the formulas!
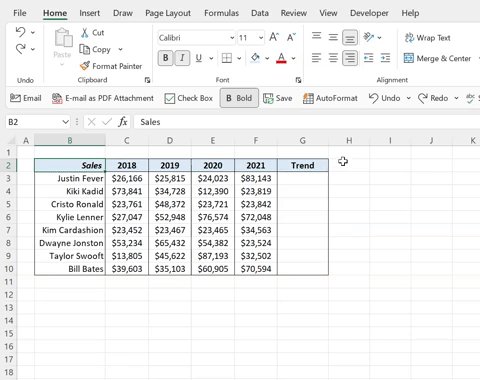
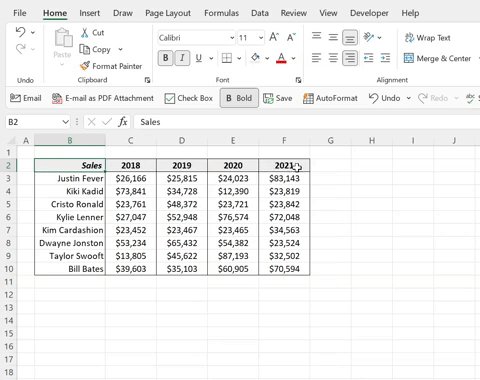
3. Sparklines
Visualizing data trends isn’t required… but it should be. QA can quickly visualize trends for you by adding sparklines. Select the data you want to visualize > QA > Sparklines tab > Line. Now just fill the sparklines down using the fill handle.
Visualizing data trends isn’t required… but it should be. QA can quickly visualize trends for you by adding sparklines. Select the data you want to visualize > QA > Sparklines tab > Line. Now just fill the sparklines down using the fill handle.
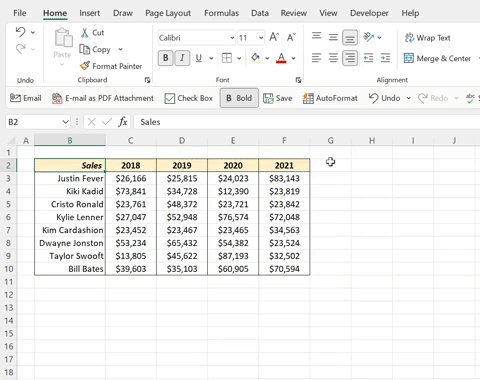
4. Creating Charts
Lets say you want to create a compelling data chart but don’t know where to begin… QA is here to help! Select data you want to graph > QA > Charts tab > browse the charts QA made. Now you can select any chart you like and insert it right into your worksheet.
Lets say you want to create a compelling data chart but don’t know where to begin… QA is here to help! Select data you want to graph > QA > Charts tab > browse the charts QA made. Now you can select any chart you like and insert it right into your worksheet.
5. Creating Tables
Now let's say you want to summarize data with a Pivot Table but don’t know how to make one… QA can do it for you! Select data you want to summarize > QA > Tables tab > browse the tables QA made. Now select any table, and it'll be inserted into your worksheet.
Now let's say you want to summarize data with a Pivot Table but don’t know how to make one… QA can do it for you! Select data you want to summarize > QA > Tables tab > browse the tables QA made. Now select any table, and it'll be inserted into your worksheet.
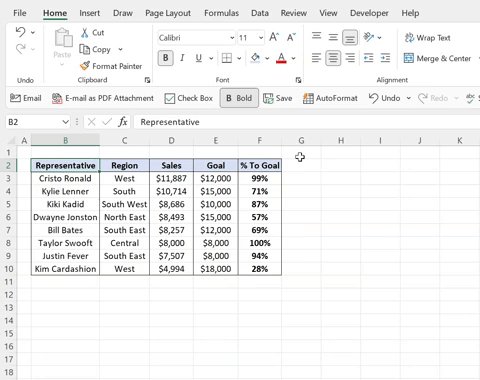
6. Data Bars
Idk about you, but data bars are much easier for me to read and compare rather than plain percentages. QA allows you to add data bars with a click of a button by selecting the data you want to visualize > QA > Formatting tab > Data Bars.
Idk about you, but data bars are much easier for me to read and compare rather than plain percentages. QA allows you to add data bars with a click of a button by selecting the data you want to visualize > QA > Formatting tab > Data Bars.
7. Color Scales
Not only can QA visualize progress using data bars, but it can also visualize the size or scale of a number compared to others using color scales. To add color scales to data using QA, select the data you want to visualize > QA > Formatting tab > Color Scale.
Not only can QA visualize progress using data bars, but it can also visualize the size or scale of a number compared to others using color scales. To add color scales to data using QA, select the data you want to visualize > QA > Formatting tab > Color Scale.
As you can see, Quick Analysis is one of Excel’s most powerful tools that analyzes your data for you.
Follow @exceldictionary for more Excel tips.
And if you never want to forget my Excel tips at your desk, check out my shortcut merch and ebooks. bit.ly
Follow @exceldictionary for more Excel tips.
And if you never want to forget my Excel tips at your desk, check out my shortcut merch and ebooks. bit.ly
Loading suggestions...