

I have 30+ charts on my weekly watchlist.
As I start to narrow it down, what is your top watch coming into this week?
As I start to narrow it down, what is your top watch coming into this week?
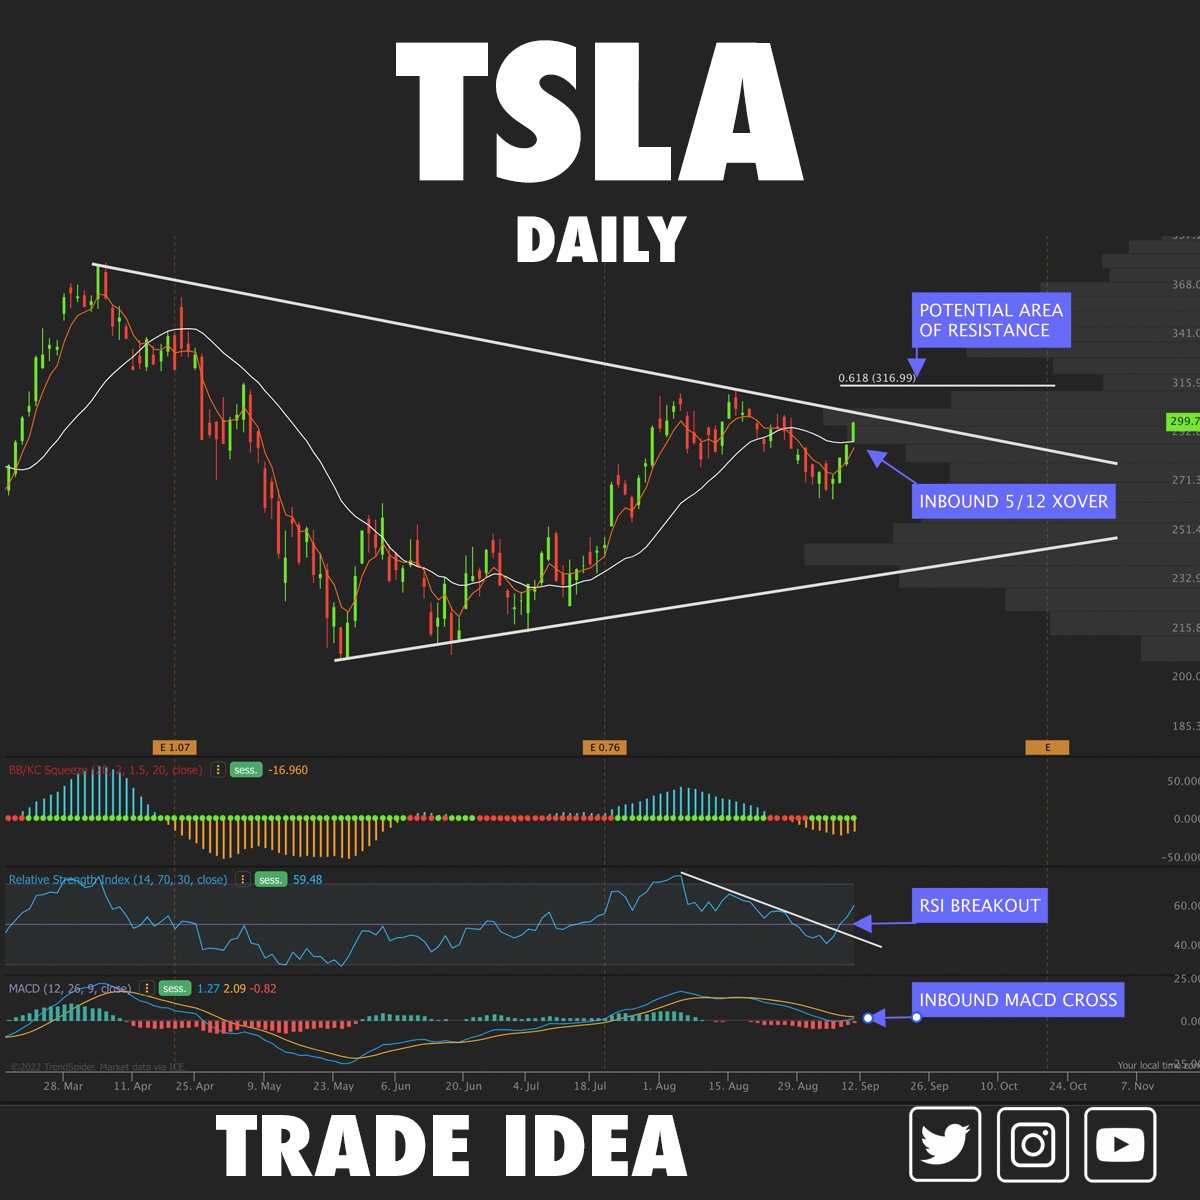
$TSLA Daily Chart
We're coming to the wedge top. This looks good for a day trade over $300, up to $313-$316.
Over 316 and this can really start to move.
We're coming to the wedge top. This looks good for a day trade over $300, up to $313-$316.
Over 316 and this can really start to move.
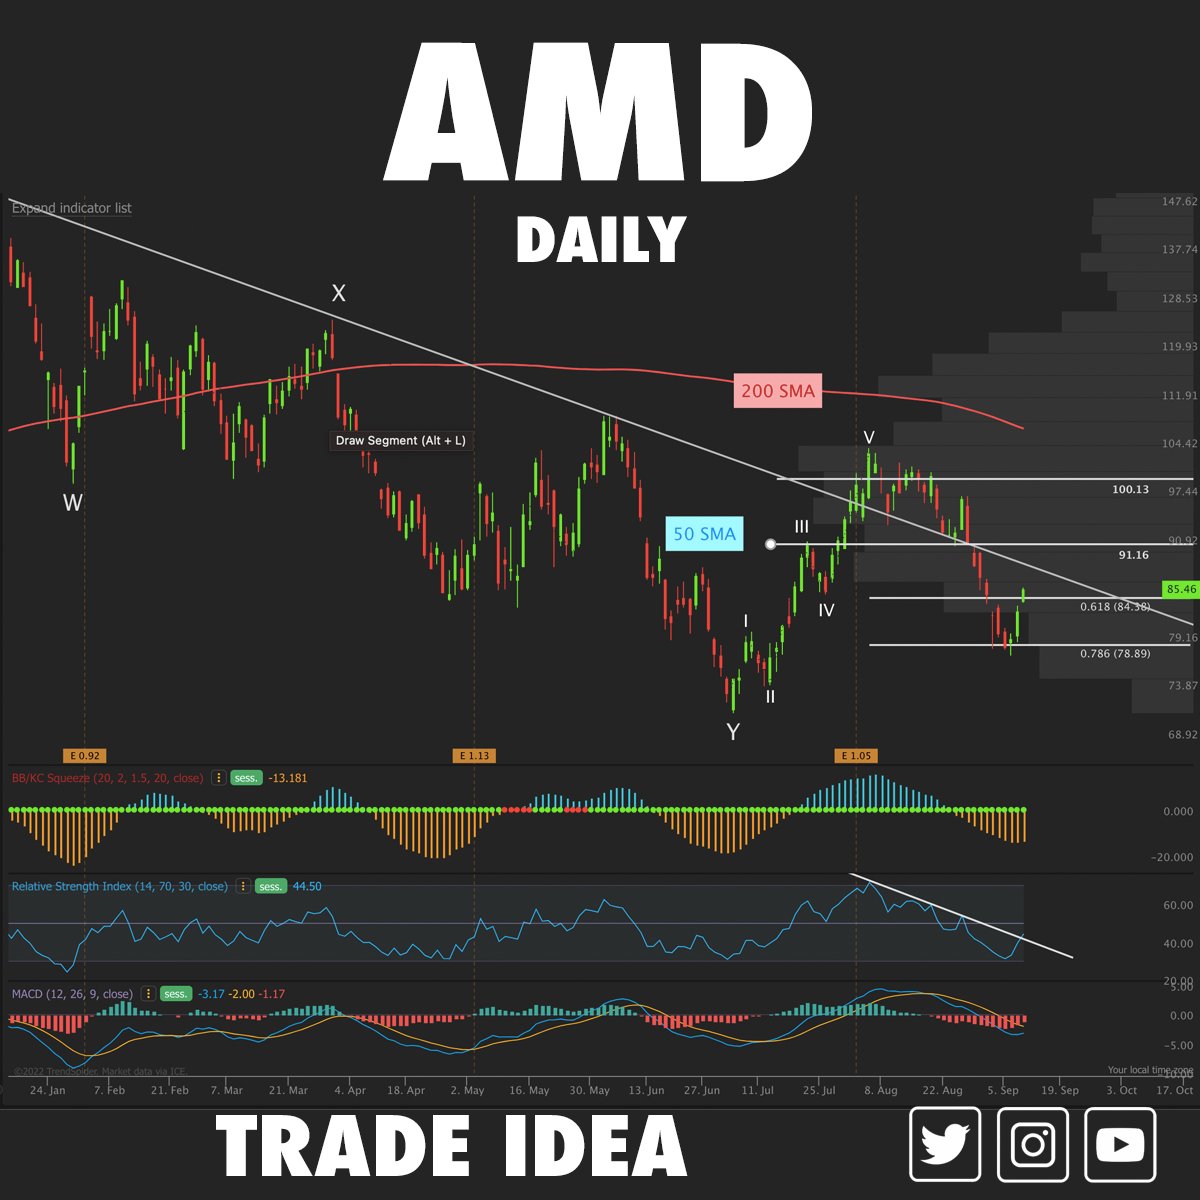
$AMD Daily Chart
It's possible the WXY is completed, and we have a 1-2 setup here.
We bounced off the .786 Fib retracement with RSI peaking over its trendline.
OVER $91 and we should see a strong move back to $100.
UNDER $85 is a good short down to $79
It's possible the WXY is completed, and we have a 1-2 setup here.
We bounced off the .786 Fib retracement with RSI peaking over its trendline.
OVER $91 and we should see a strong move back to $100.
UNDER $85 is a good short down to $79
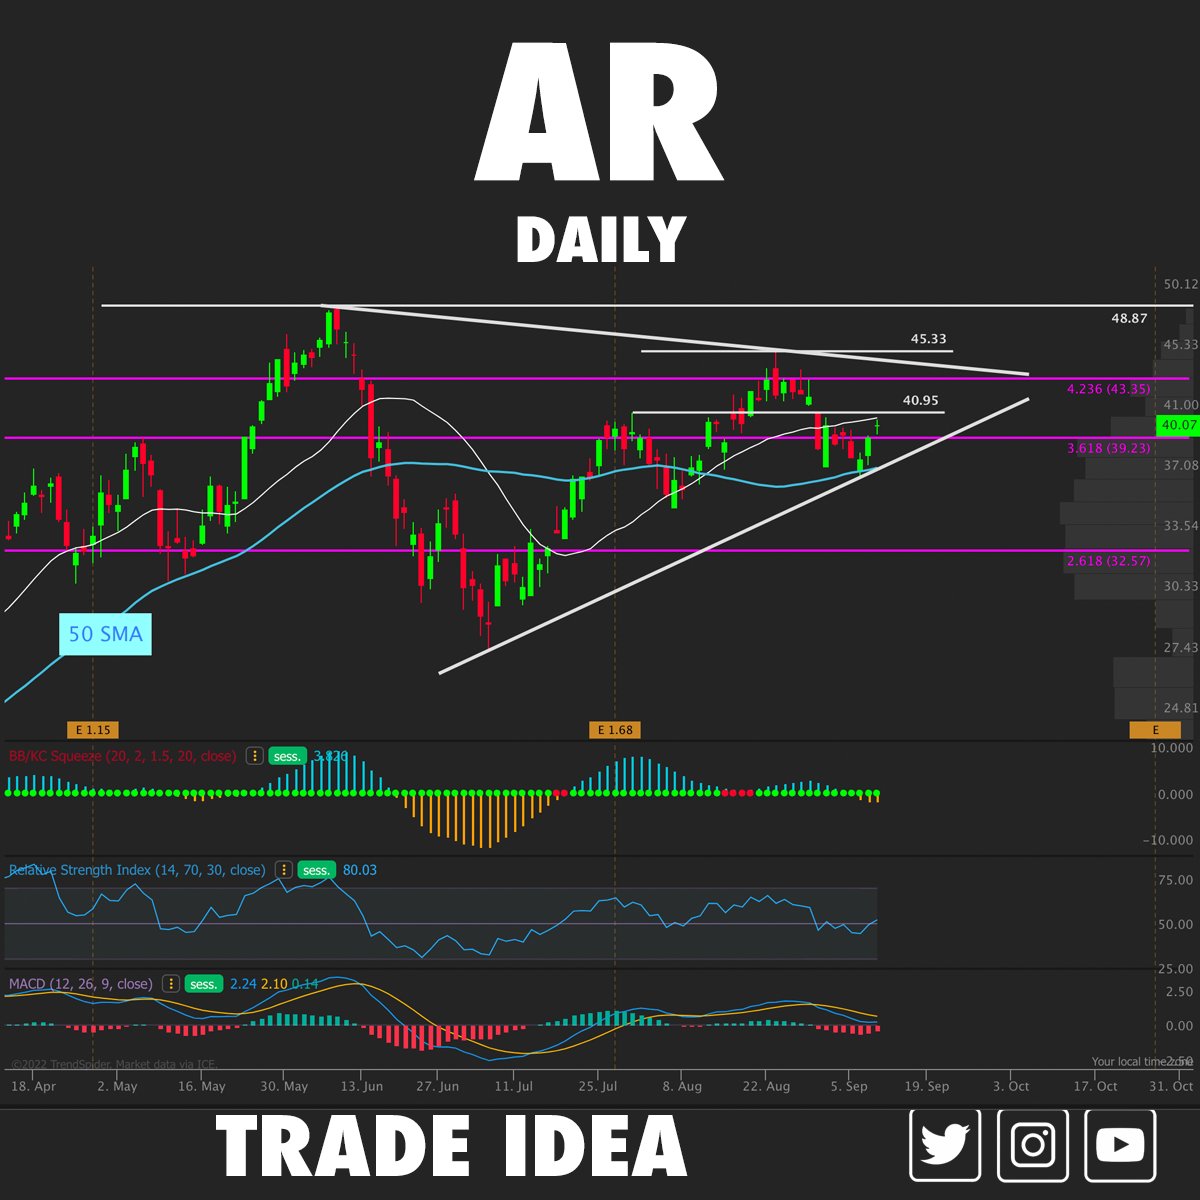
$AR Daily Chart
Bounced at the 50 SMA last week and now sitting right under the 21 EMA.
A break over $41 should send up to the top of the wedge.
Over $45.33 and $49 will come next.
Chart courtesy of @trendspider
Bounced at the 50 SMA last week and now sitting right under the 21 EMA.
A break over $41 should send up to the top of the wedge.
Over $45.33 and $49 will come next.
Chart courtesy of @trendspider
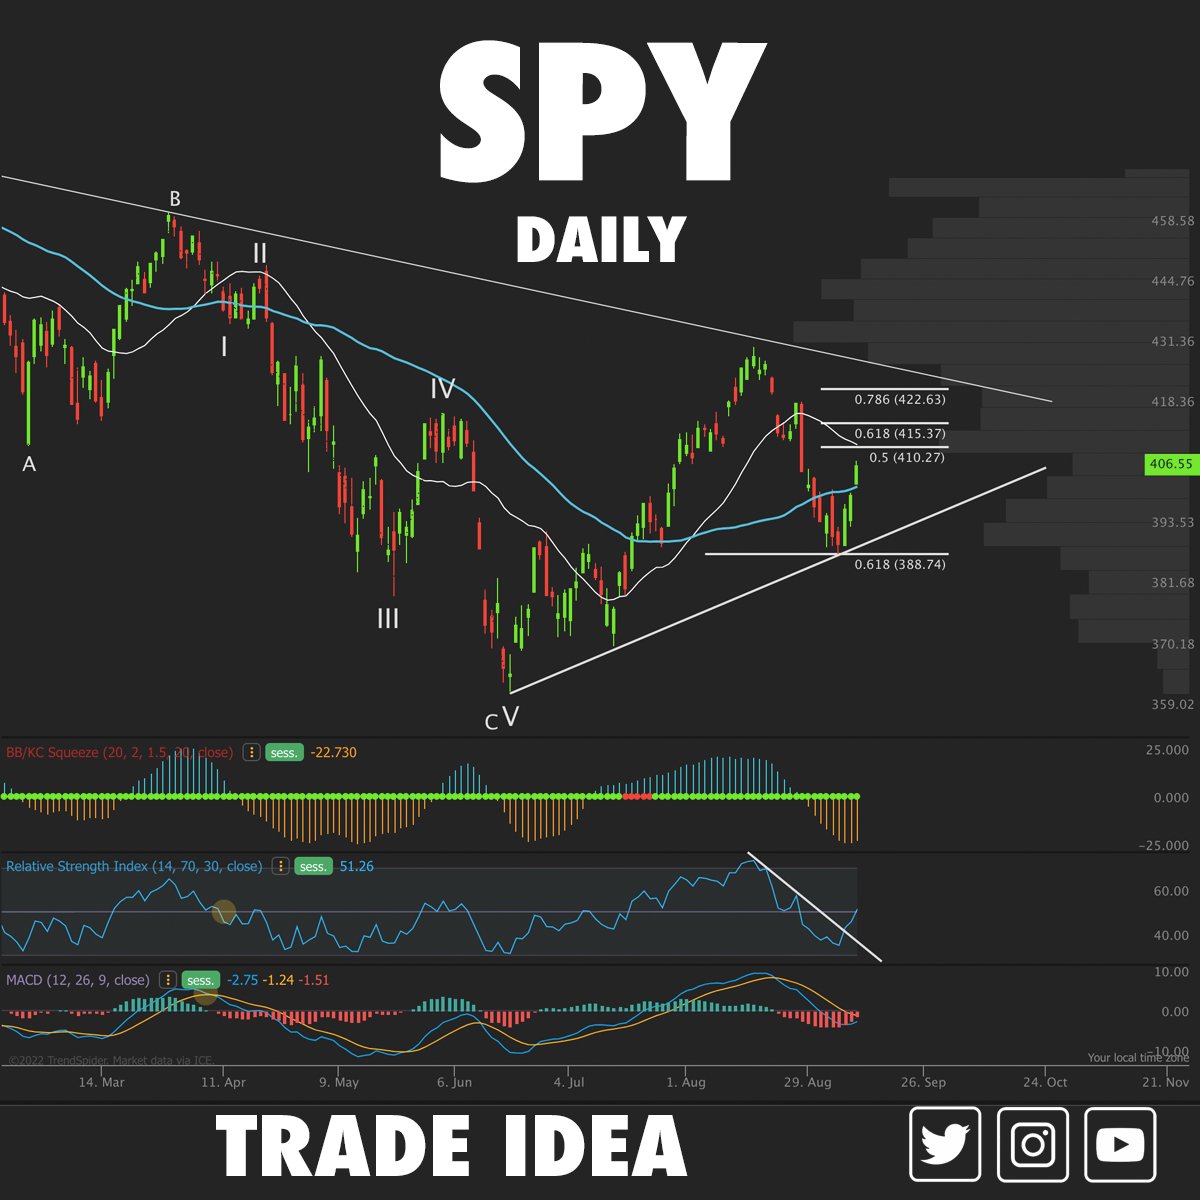
$SPY Daily
Perfect bounce off the .618 Fib retracement last week.
On this bounce, I will be watching the .618 back up at $415, which has acted as a key level in the past.
RSI is breaking out & MACD is curling up.
Upside targets: $408/$411/$415
Chart courtesy @trendspider
Perfect bounce off the .618 Fib retracement last week.
On this bounce, I will be watching the .618 back up at $415, which has acted as a key level in the past.
RSI is breaking out & MACD is curling up.
Upside targets: $408/$411/$415
Chart courtesy @trendspider
I hope you are enjoying this chart drop.
If you have a moment, please retweet the original post (below), so more people can see my work.
I appreciate you! 👊
If you have a moment, please retweet the original post (below), so more people can see my work.
I appreciate you! 👊
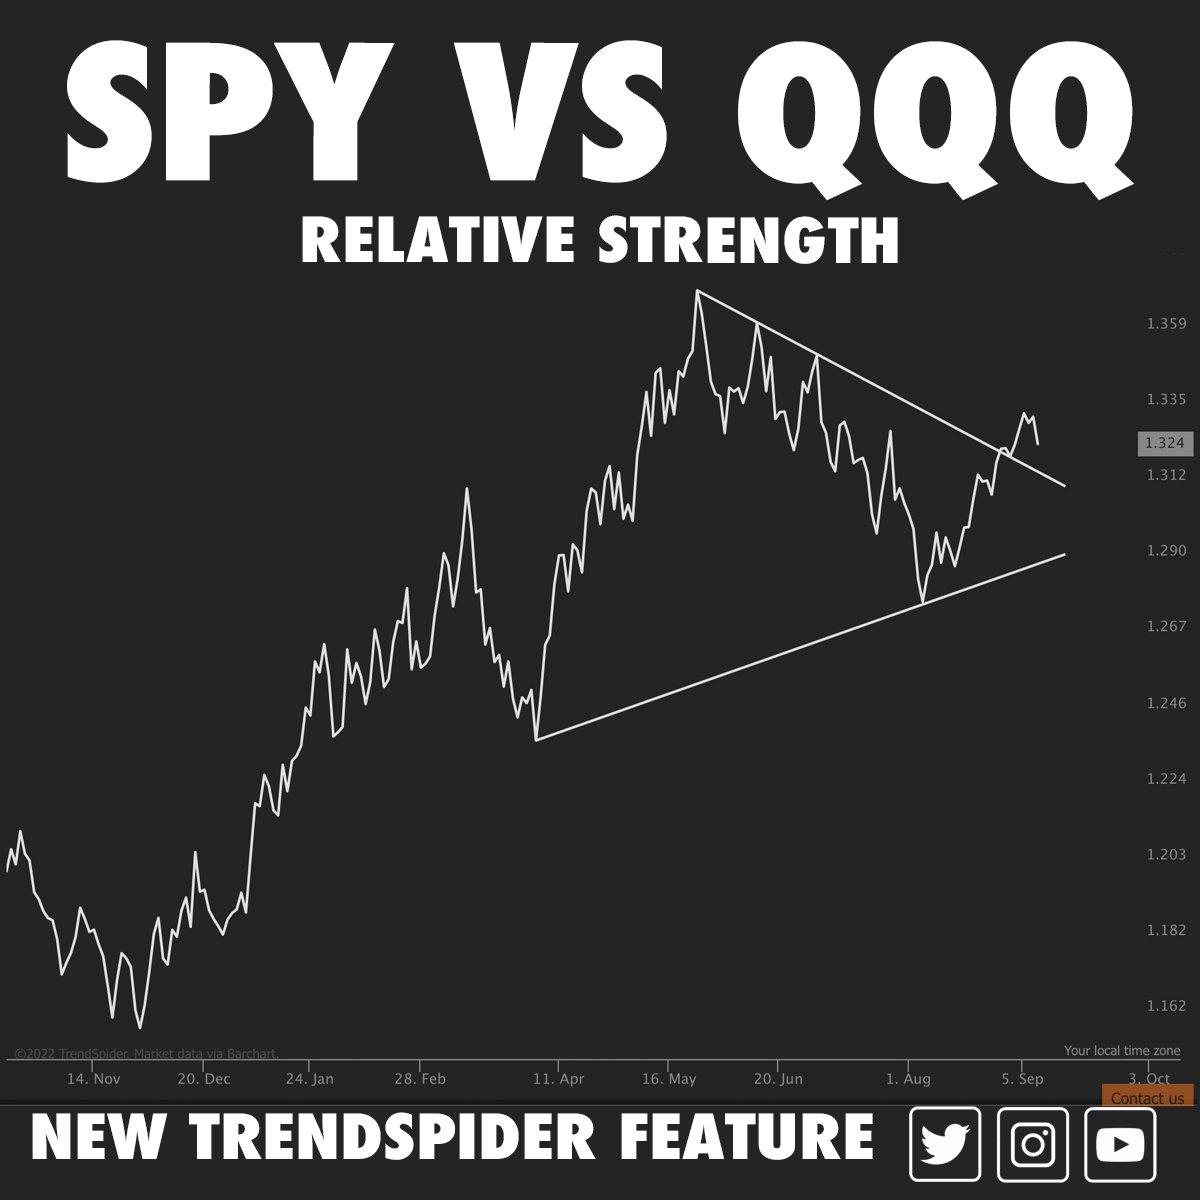
$SPY vs $QQQ
This chart compares the two tickers.
SPY is showing relative strength to QQQ.
Read more about this new feature from @TrendSpider
Signup for a free trial and use code PUP25 for 25% off
trendspider.com
This chart compares the two tickers.
SPY is showing relative strength to QQQ.
Read more about this new feature from @TrendSpider
Signup for a free trial and use code PUP25 for 25% off
trendspider.com
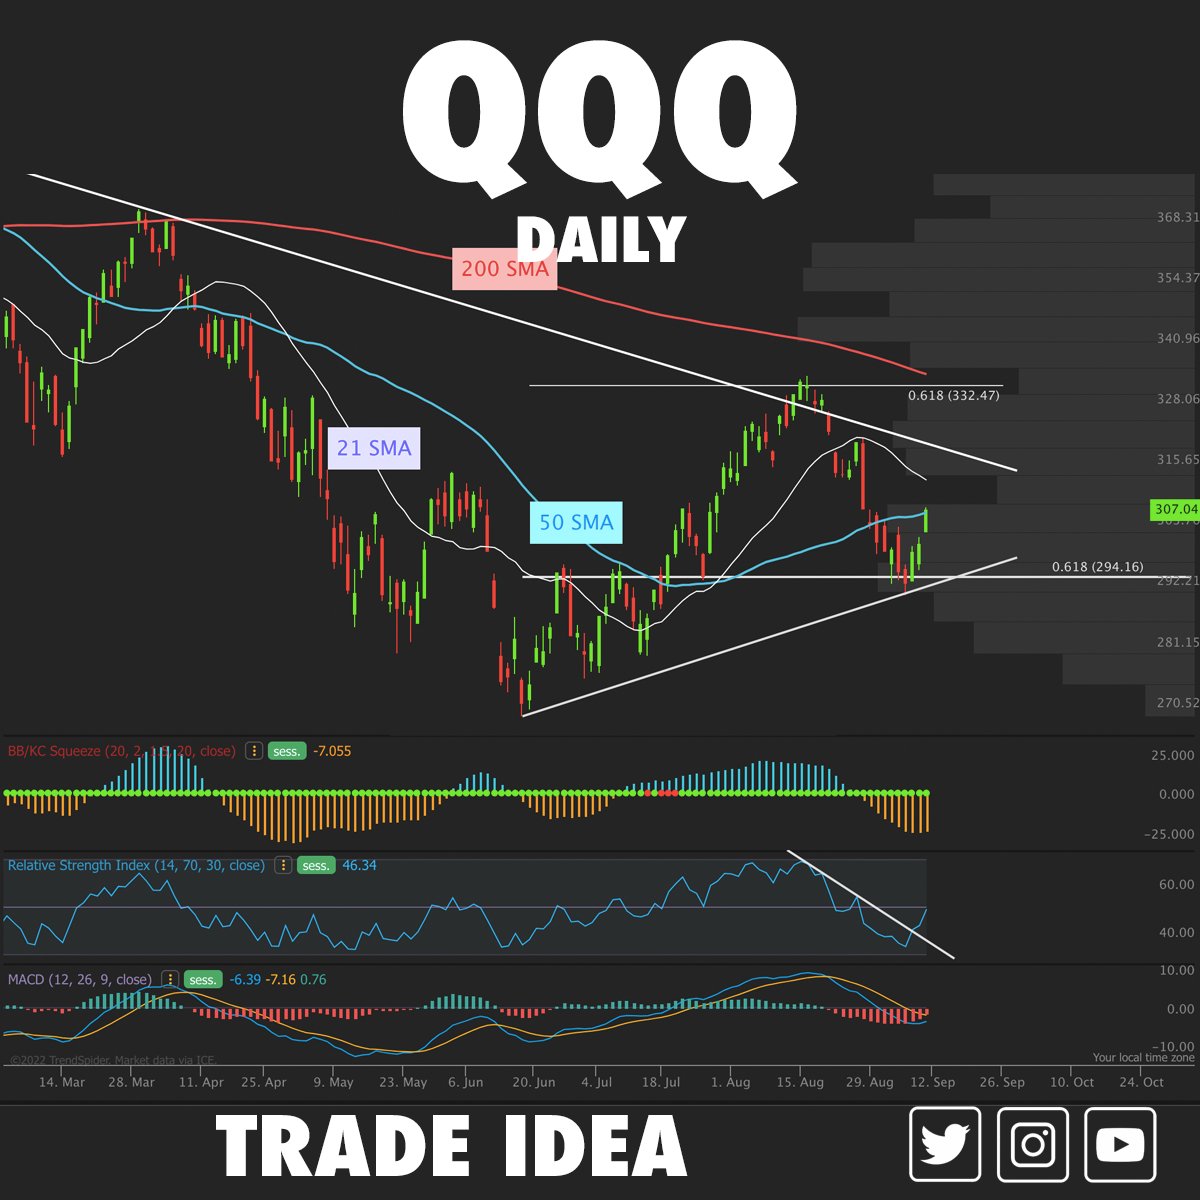
$QQQ Daily Chart
We closed about the 50 SMA on Friday.
$309 and $315 are my upside targets from here. If we break above the wedge, watch for a move to the .618 Fib at $332.
Chart courtesy of @trendspider
We closed about the 50 SMA on Friday.
$309 and $315 are my upside targets from here. If we break above the wedge, watch for a move to the .618 Fib at $332.
Chart courtesy of @trendspider
$XBI Daily Chart
Biotech has been hot the last 3 trading days.
We're setting up with an inverse head and shoulders right under the 200 SMA.
I am also seeing bullish hidden divergence with price making higher lows & RSI lower lows.
RSI is also breaking out.
Chart @TrendSpider
Biotech has been hot the last 3 trading days.
We're setting up with an inverse head and shoulders right under the 200 SMA.
I am also seeing bullish hidden divergence with price making higher lows & RSI lower lows.
RSI is also breaking out.
Chart @TrendSpider
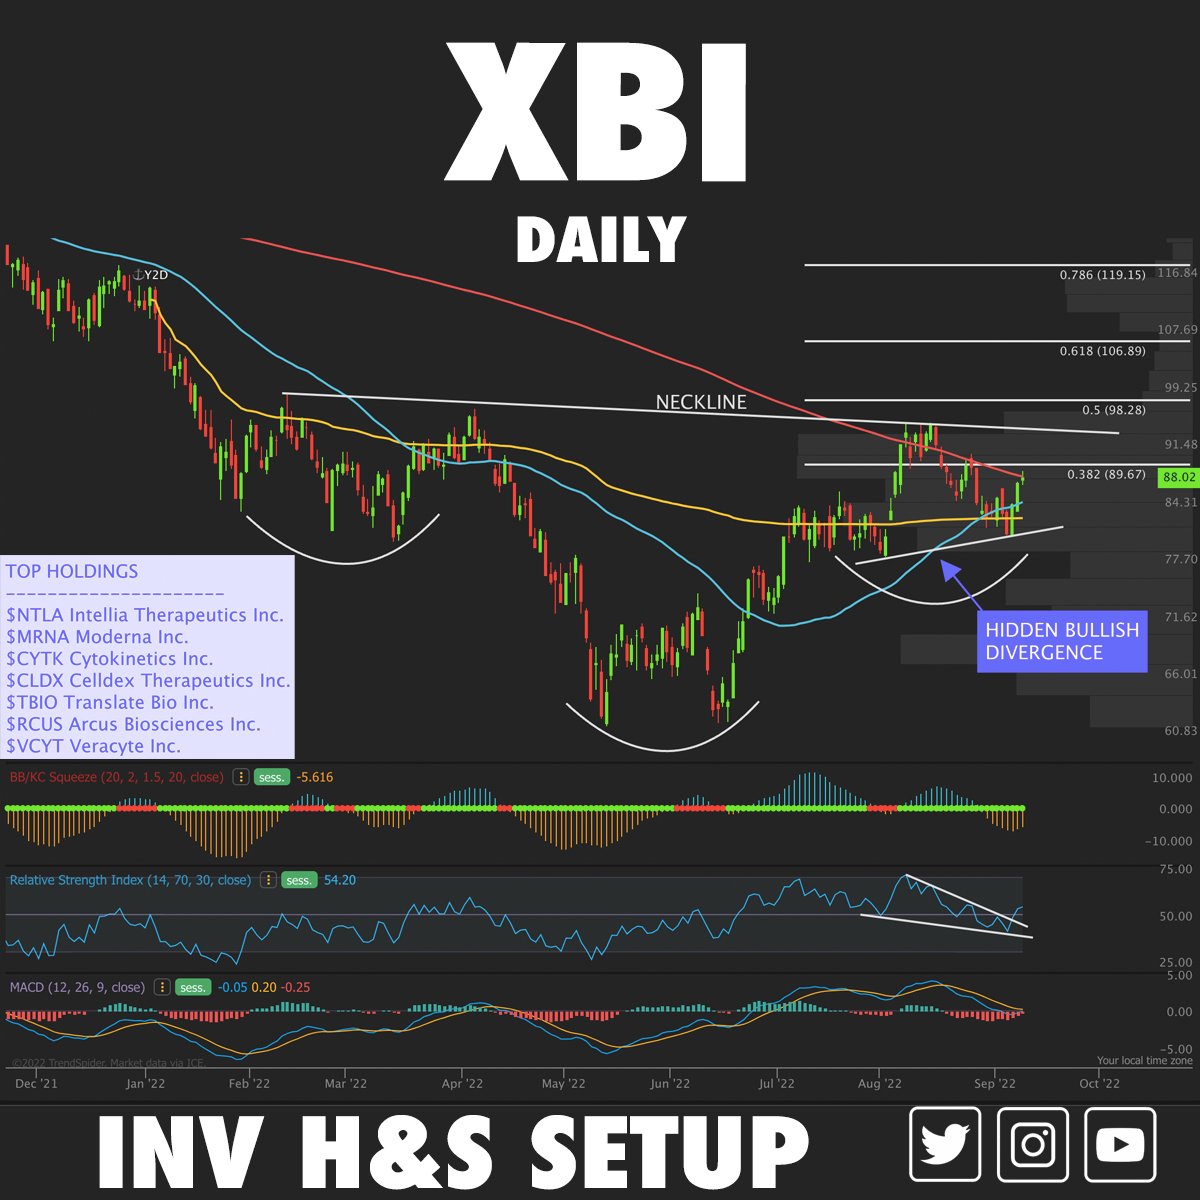
Top holdings for $XBI
$NTLA Intellia Therapeutics Inc.
$MRNA Moderna Inc.
$CYTK Cytokinetics Inc.
$CLDX Celldex Therapeutics Inc.
$TBIO Translate Bio Inc.
$RCUS Arcus Biosciences Inc.
$VCYT Veracyte Inc.
$NTLA Intellia Therapeutics Inc.
$MRNA Moderna Inc.
$CYTK Cytokinetics Inc.
$CLDX Celldex Therapeutics Inc.
$TBIO Translate Bio Inc.
$RCUS Arcus Biosciences Inc.
$VCYT Veracyte Inc.
Happy Saturday!
My newsletter The Dig comes out tomorrow. Here's what you can expect:
• Index charts $SPY $QQQ $IWM
• Sector watchlist
• Earnings preview
• Economic calendar
• Sector rotation & performance
• Weekend Videos (sector & top tech)
getrevue.co
My newsletter The Dig comes out tomorrow. Here's what you can expect:
• Index charts $SPY $QQQ $IWM
• Sector watchlist
• Earnings preview
• Economic calendar
• Sector rotation & performance
• Weekend Videos (sector & top tech)
getrevue.co
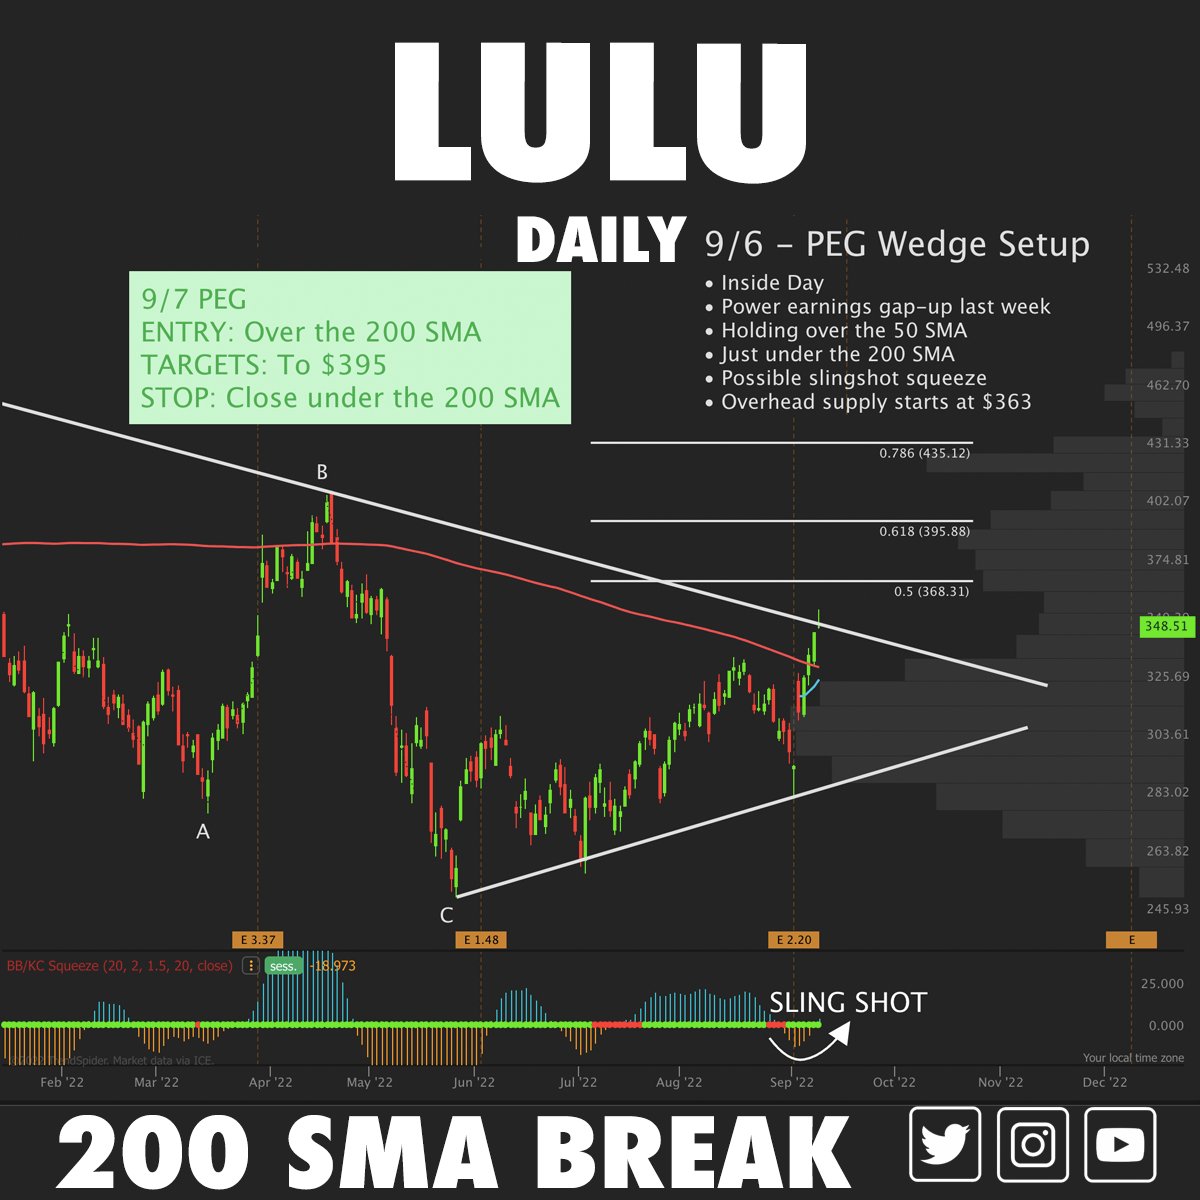
$LULU Daily Chart
Nailed this trade last week after earnings. We stopped at the wedge top.
I have $350 on watch this week with a short-term target of $368, which is the 50% Fib retracement and the start of the next supply zone.
Chart courtesy of @TrendSpider
Nailed this trade last week after earnings. We stopped at the wedge top.
I have $350 on watch this week with a short-term target of $368, which is the 50% Fib retracement and the start of the next supply zone.
Chart courtesy of @TrendSpider
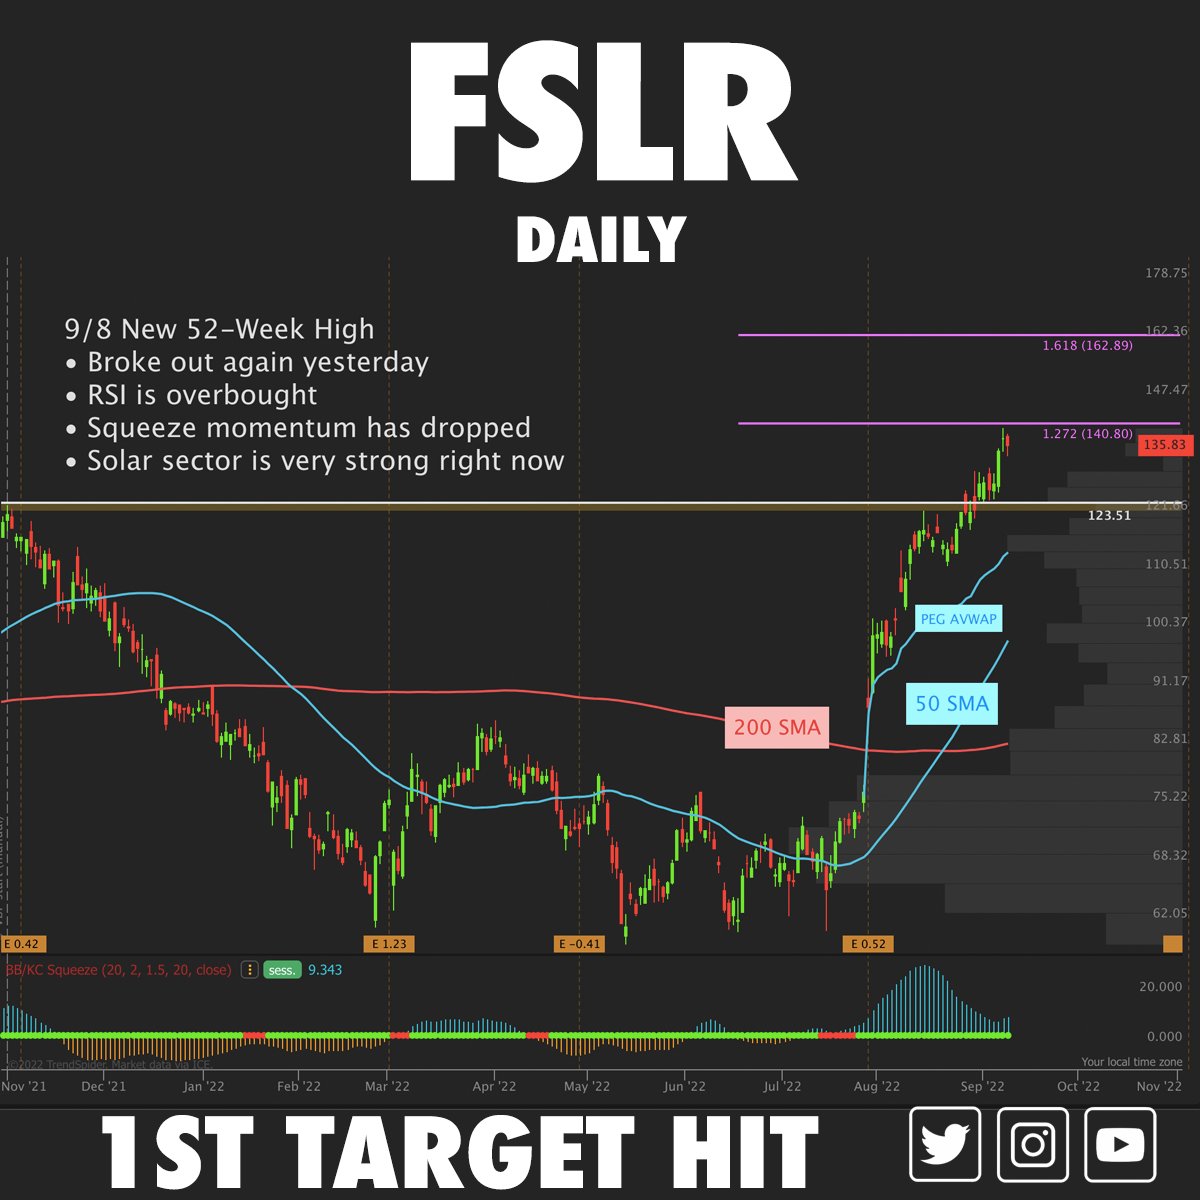
$FSLR Daily Chart
We nailed this trade last week.
Watching for consolidation under $140. My target for this trade will be $162.
Chart courtesy of @trendspider
We nailed this trade last week.
Watching for consolidation under $140. My target for this trade will be $162.
Chart courtesy of @trendspider
#Bitcoin
We're coming back up to the 50 SMA right at the center of our falling channel. We're also sitting in supply.
We're seeing bullish hidden divergence on RSI.
25K will be a battle ground.
Chart courtesy of @trendspider
We're coming back up to the 50 SMA right at the center of our falling channel. We're also sitting in supply.
We're seeing bullish hidden divergence on RSI.
25K will be a battle ground.
Chart courtesy of @trendspider

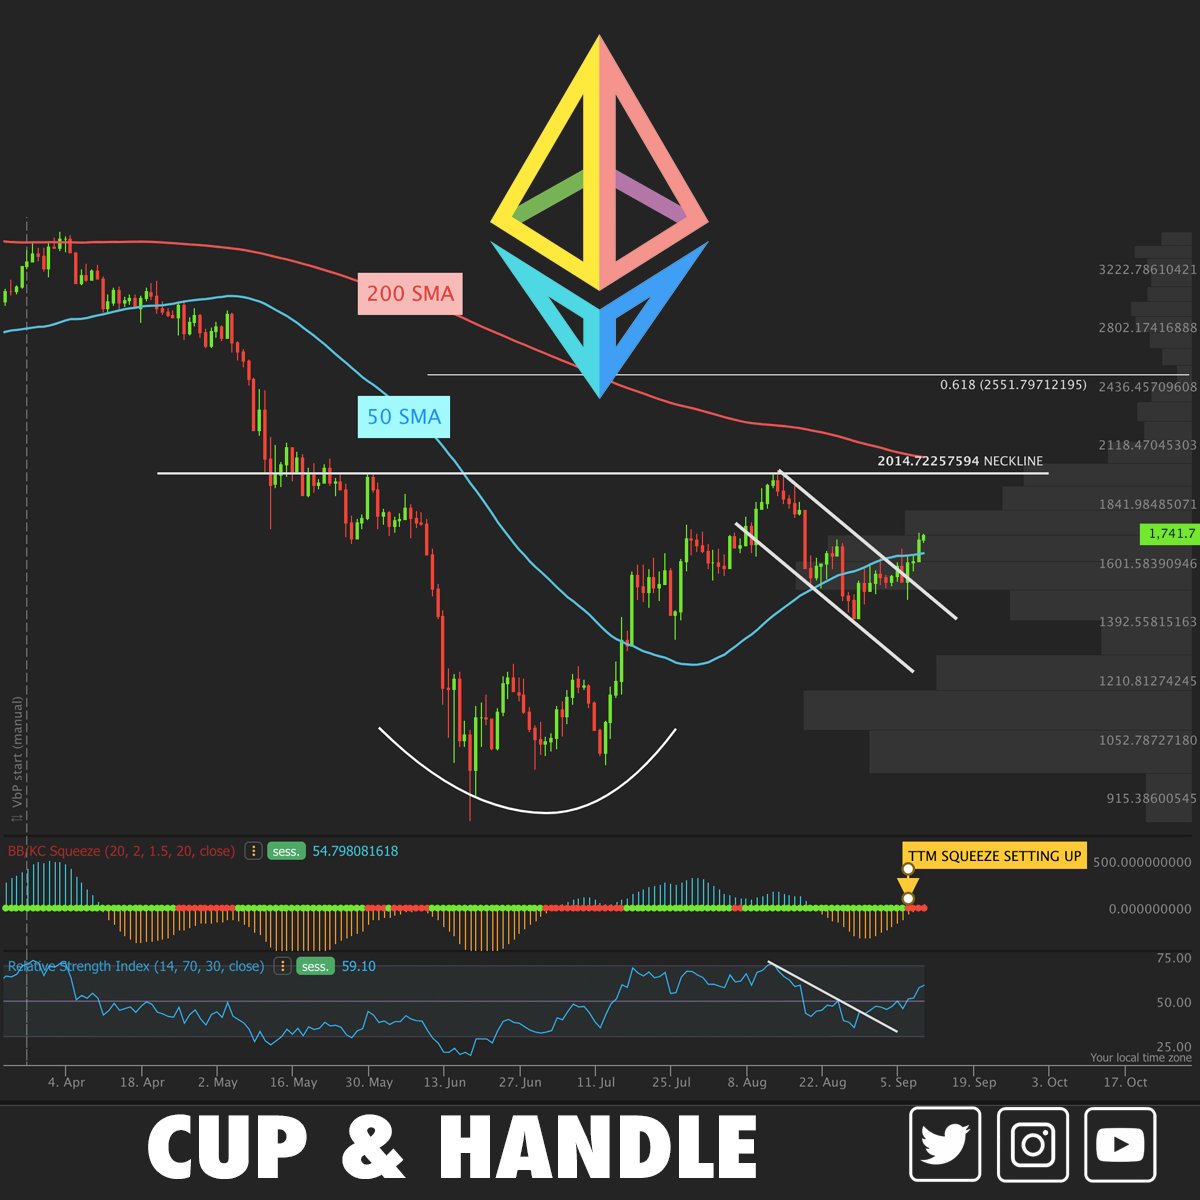
#Ethereum
Cup & handle setup with a break of the handle in progress.
Our neckline will be just over 2K.
We also have RSI breaking over 50 and a TTM squeeze setting up.
Chart courtesy of @TrendSpider
Cup & handle setup with a break of the handle in progress.
Our neckline will be just over 2K.
We also have RSI breaking over 50 and a TTM squeeze setting up.
Chart courtesy of @TrendSpider
$SNOW Daily Chart
We're stuck between the 50/200 SMAs, but we closed over the year-to-date anchored VWAP and broke through the center channel. The last time we gapped over it.
RSI bounced at 50 last week. On the chart for an entry.
Chart courtesy of @trendSpider
We're stuck between the 50/200 SMAs, but we closed over the year-to-date anchored VWAP and broke through the center channel. The last time we gapped over it.
RSI bounced at 50 last week. On the chart for an entry.
Chart courtesy of @trendSpider

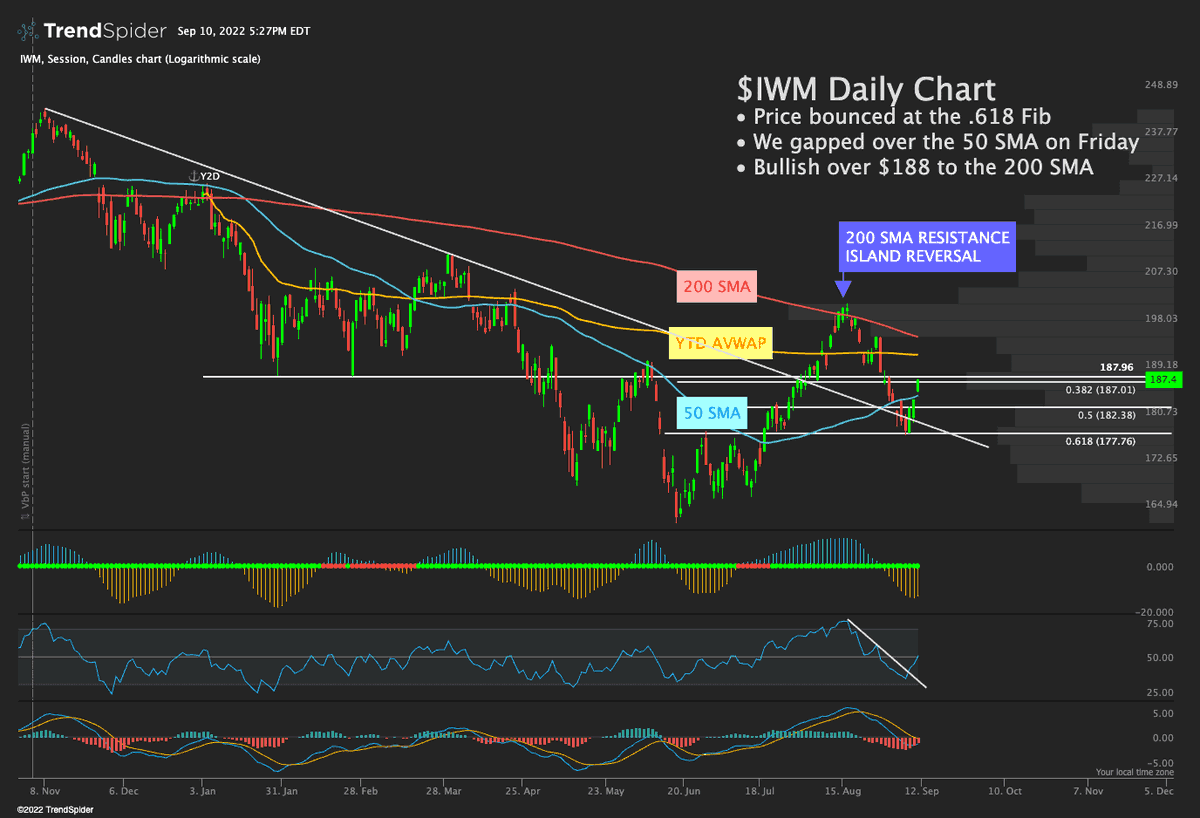
$IWM Daily Chart
• Price bounced at the .618 Fib
• We gapped over the 50 SMA on Friday
• Bullish over $188 to the 200 SMA
• Price bounced at the .618 Fib
• We gapped over the 50 SMA on Friday
• Bullish over $188 to the 200 SMA
Loading suggestions...