

As a trader in London, I used to look at some economic indicators to understand broad contours of world economy.
A thread on inflation expectations, yield curve inversion & fed rate hikes with resources to track them. MOST relevant today🧵
Pls like & share for max reach
1/10
A thread on inflation expectations, yield curve inversion & fed rate hikes with resources to track them. MOST relevant today🧵
Pls like & share for max reach
1/10
Inflation Expectations: Rate at which economic actors expect inflation to rise. If everyone expects price to rise 8%, they actually rise by 8%.
How? Businesses demand 8% more price, labor demands 8% more wage, causing actual 8% price rise
A forward indicator of inflation.
2/10
How? Businesses demand 8% more price, labor demands 8% more wage, causing actual 8% price rise
A forward indicator of inflation.
2/10
So central banks want inflation expectations to remain near their target inflation rate. (India - 4-6%; US - 2%)
If they start rising, central banks are worried of inflation getting generalized in the whole economy. The take decision to tighten monetary policy even more
3/10
If they start rising, central banks are worried of inflation getting generalized in the whole economy. The take decision to tighten monetary policy even more
3/10
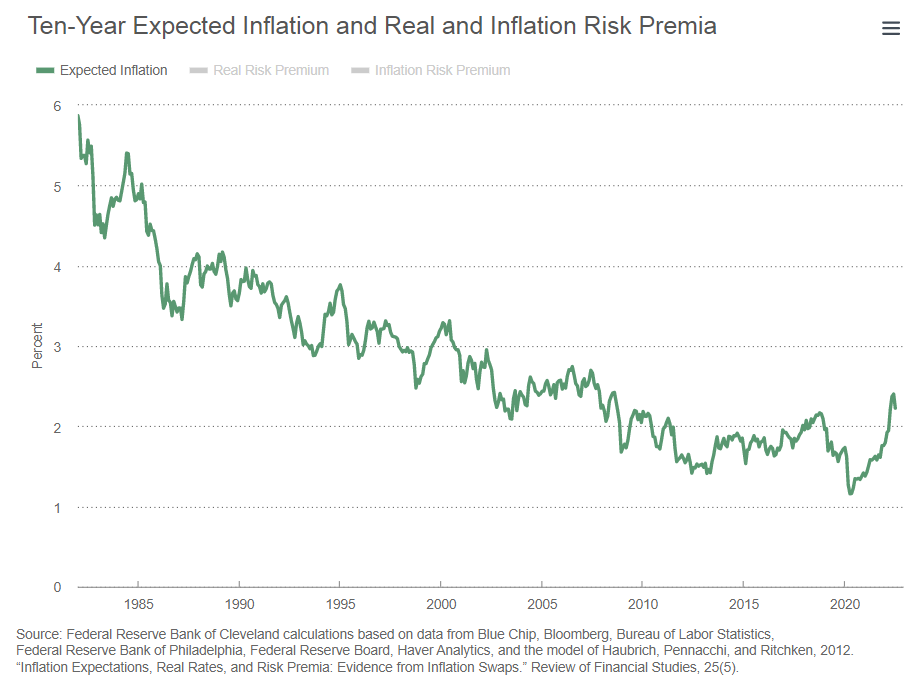
How to check inflation and its expectations for US:
clevelandfed.org
You can see how the expectations started rising after 2020 and have started stabilizing now
4/10
clevelandfed.org
You can see how the expectations started rising after 2020 and have started stabilizing now
4/10

Yield Curve:
Yield is the return (interest rate) on govt bonds & Yield curve plots the yield of bonds with different maturities like 3 mon, 2yr, 5yr, 10 yr
Normally, yield curve is upward sloping as bond of longer maturity give higher return coz of higher risk (Like FDs)
5/10
Yield is the return (interest rate) on govt bonds & Yield curve plots the yield of bonds with different maturities like 3 mon, 2yr, 5yr, 10 yr
Normally, yield curve is upward sloping as bond of longer maturity give higher return coz of higher risk (Like FDs)
5/10
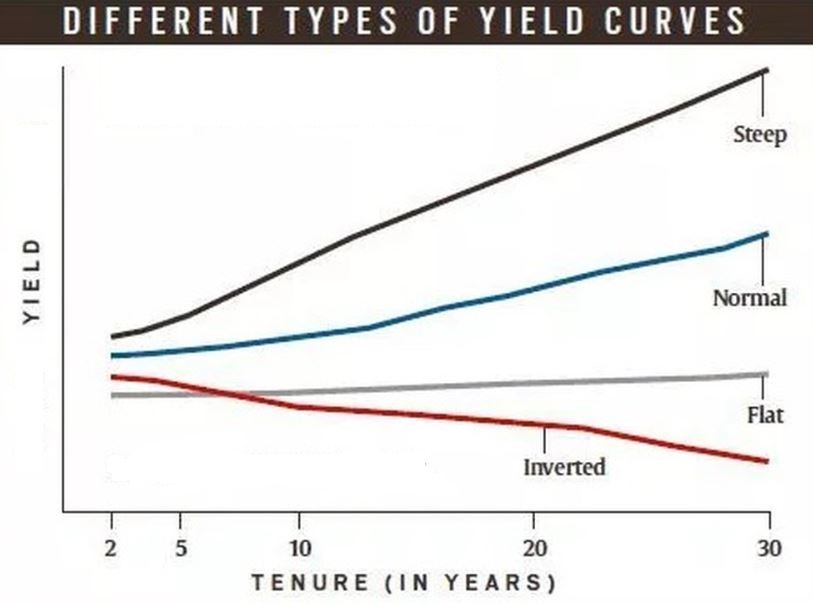
Inversion happens when 2 year yield > 10 year yield. Its a predictor of upcoming recession.
Mostly happens after Fed tightening ie rising short term rates. This is expected to reduce economic activity & Fed to lower rates in future. Thus long term rates are lower.
6/10
Mostly happens after Fed tightening ie rising short term rates. This is expected to reduce economic activity & Fed to lower rates in future. Thus long term rates are lower.
6/10
Inversion can be checked through downward sloping yield curve,
or plotting difference between 10yr yield and 2 yr yield.
10yr - 2yr spread becomes negative in case of inversion
Check this & recession probability here for US:
newyorkfed.org
7/10
or plotting difference between 10yr yield and 2 yr yield.
10yr - 2yr spread becomes negative in case of inversion
Check this & recession probability here for US:
newyorkfed.org
7/10

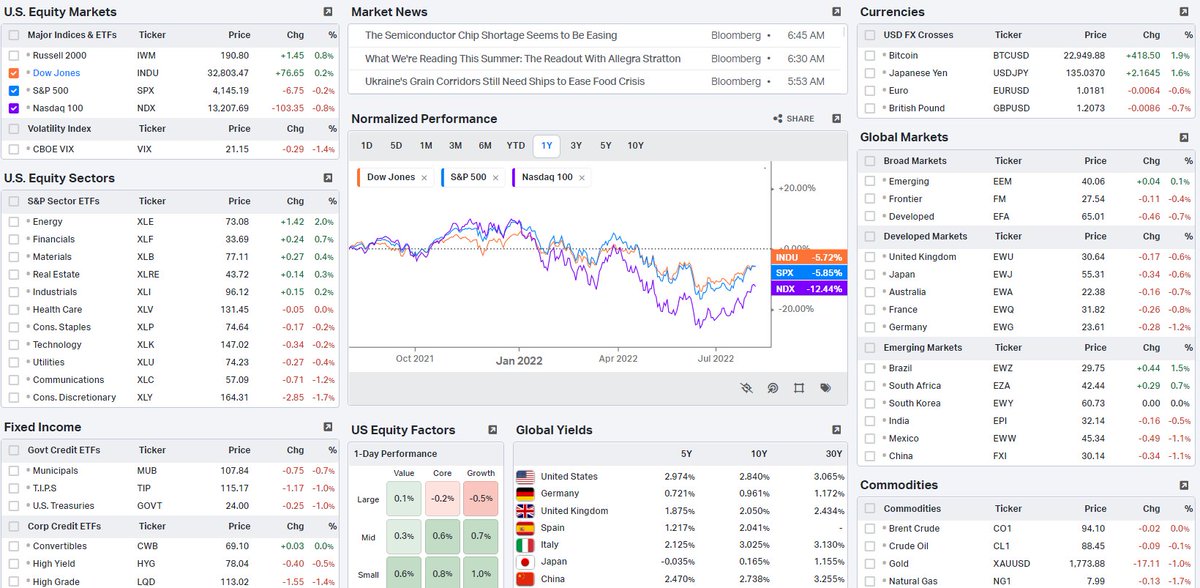
For seeing, yields, yield curves of all major countries along with commodity prices, markets, currencies etc, use this awesome website:
- Go to market dashboards, to see yield, yield curves
app.koyfin.com
8/10
- Go to market dashboards, to see yield, yield curves
app.koyfin.com
8/10

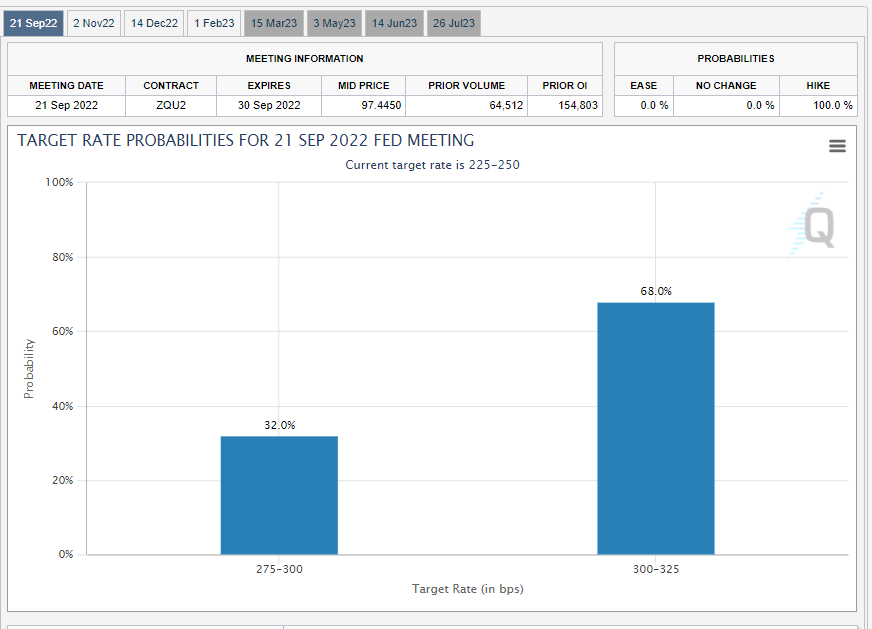
Fed funds rate
FOMC fixes fed funds rate in response to inflation and other economic conditions.
The implied probabilities of rate hike in next meeting based on bond markets can be seen from below. It shows how much chance is of 50 bps hike etc
cmegroup.com
9/10
FOMC fixes fed funds rate in response to inflation and other economic conditions.
The implied probabilities of rate hike in next meeting based on bond markets can be seen from below. It shows how much chance is of 50 bps hike etc
cmegroup.com
9/10
That's it on the latest and most relevant economic concepts of current times.
If you enjoyed this thread please like and share with friends
10/10
If you enjoyed this thread please like and share with friends
10/10
Loading suggestions...