

How to do Top-down analysis and how to get directional bias and lower time frame entries.
Welcome to another thread on "Learning Technical Analysis".
-Time frames.
Let's dive in.
Here we'd start from a higher time frame, then work our way down to the lower time frames.
Welcome to another thread on "Learning Technical Analysis".
-Time frames.
Let's dive in.
Here we'd start from a higher time frame, then work our way down to the lower time frames.
Case study: #BTC
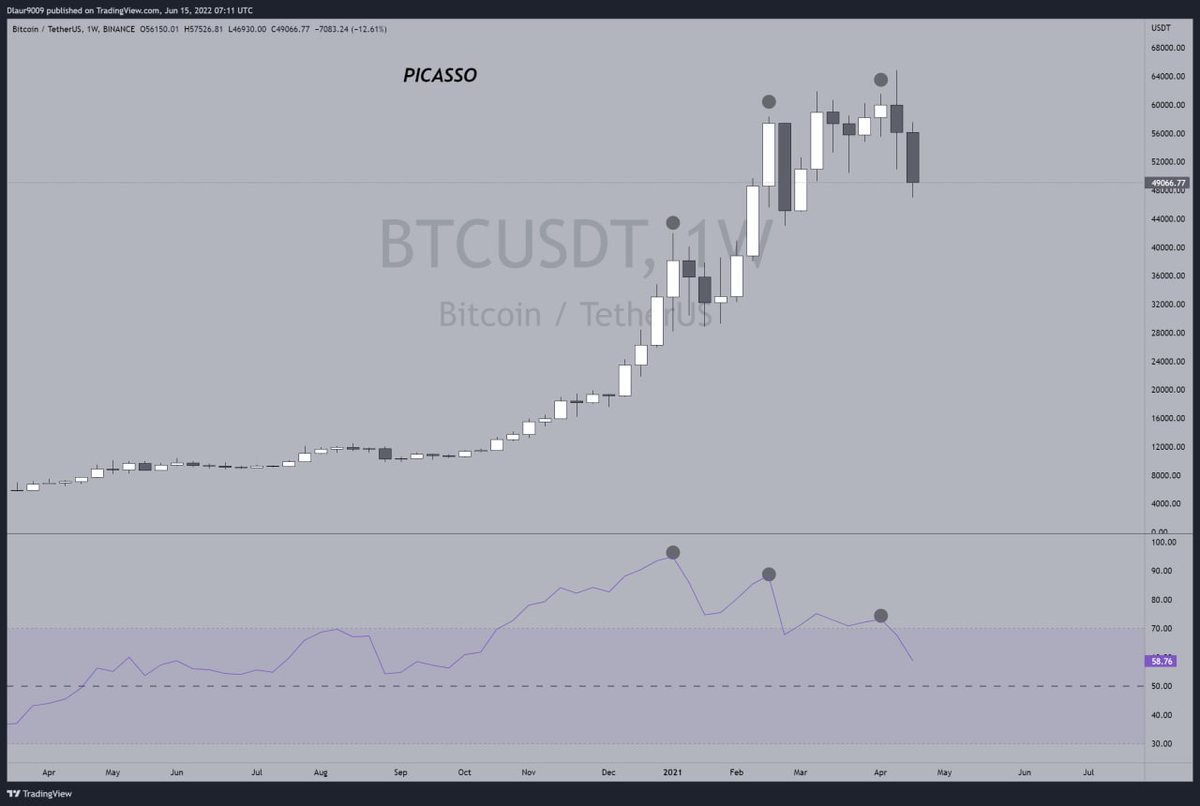
Weekly time frame.
The rally starts looking weak, no more impulsive pumps, RSI is overbought and have formed a bearish divergence.
This sets us up for where we think we may be headed, so we go down to another timeframe for more confirmation.
Weekly time frame.
The rally starts looking weak, no more impulsive pumps, RSI is overbought and have formed a bearish divergence.
This sets us up for where we think we may be headed, so we go down to another timeframe for more confirmation.
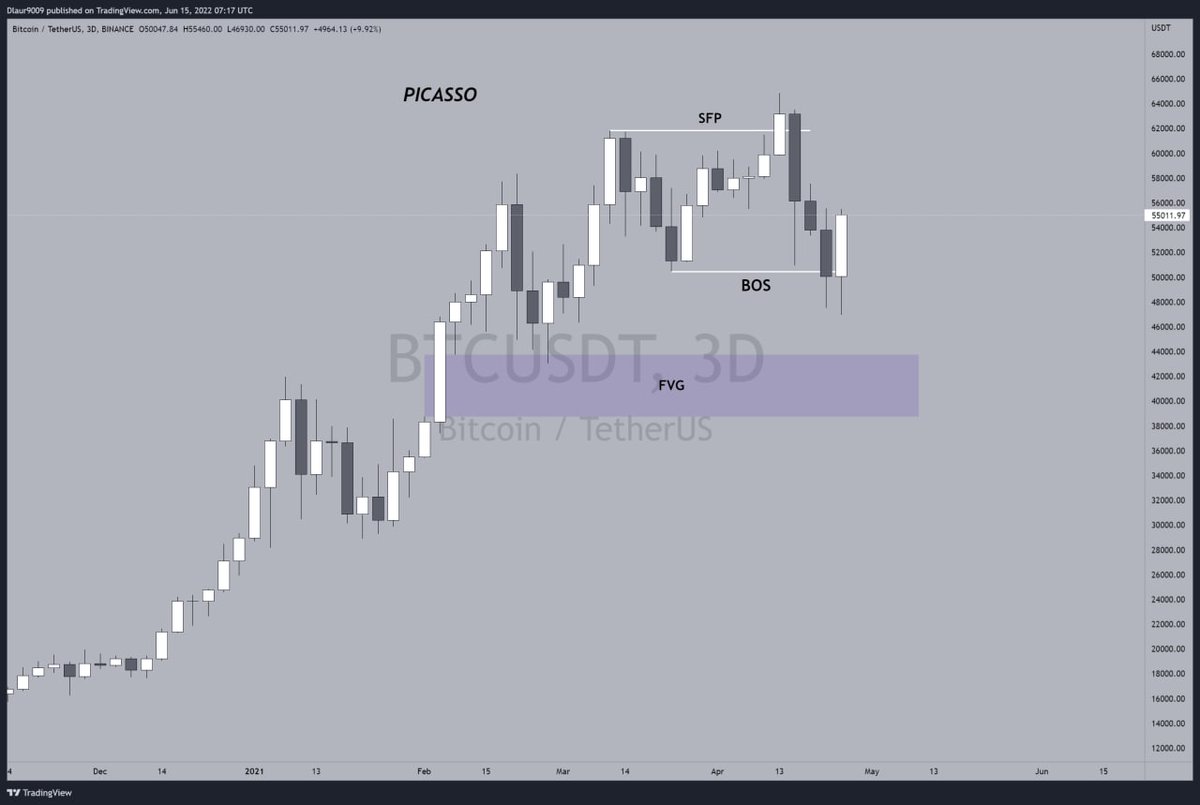
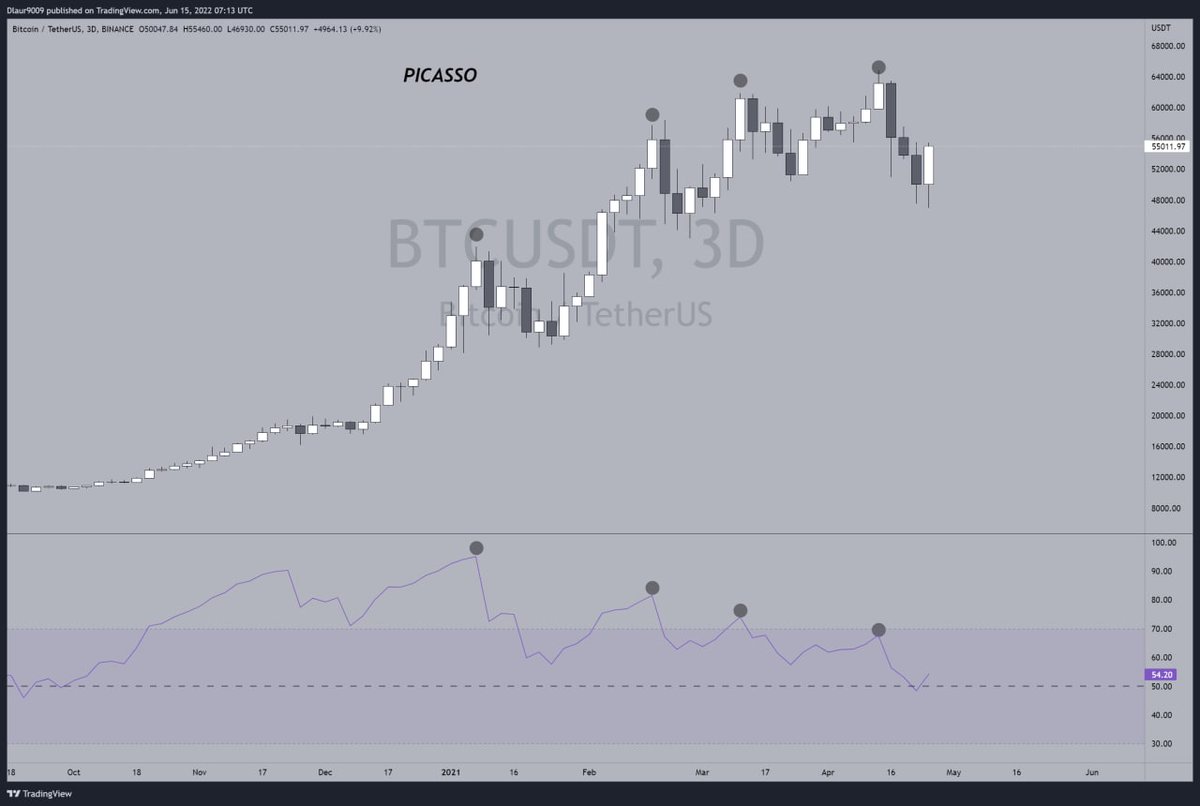
D3
Swing failure pattern or liquidity raid here, and a break of structure to the downside shows us where the market intends to move to.
Swing failure pattern or liquidity raid here, and a break of structure to the downside shows us where the market intends to move to.
RSI bearish Divergence also visible on this timeframe, giving us another confirmation.
This sets up our directional bias for the next moves but let's go to the daily to get even more confirmation.
This sets up our directional bias for the next moves but let's go to the daily to get even more confirmation.
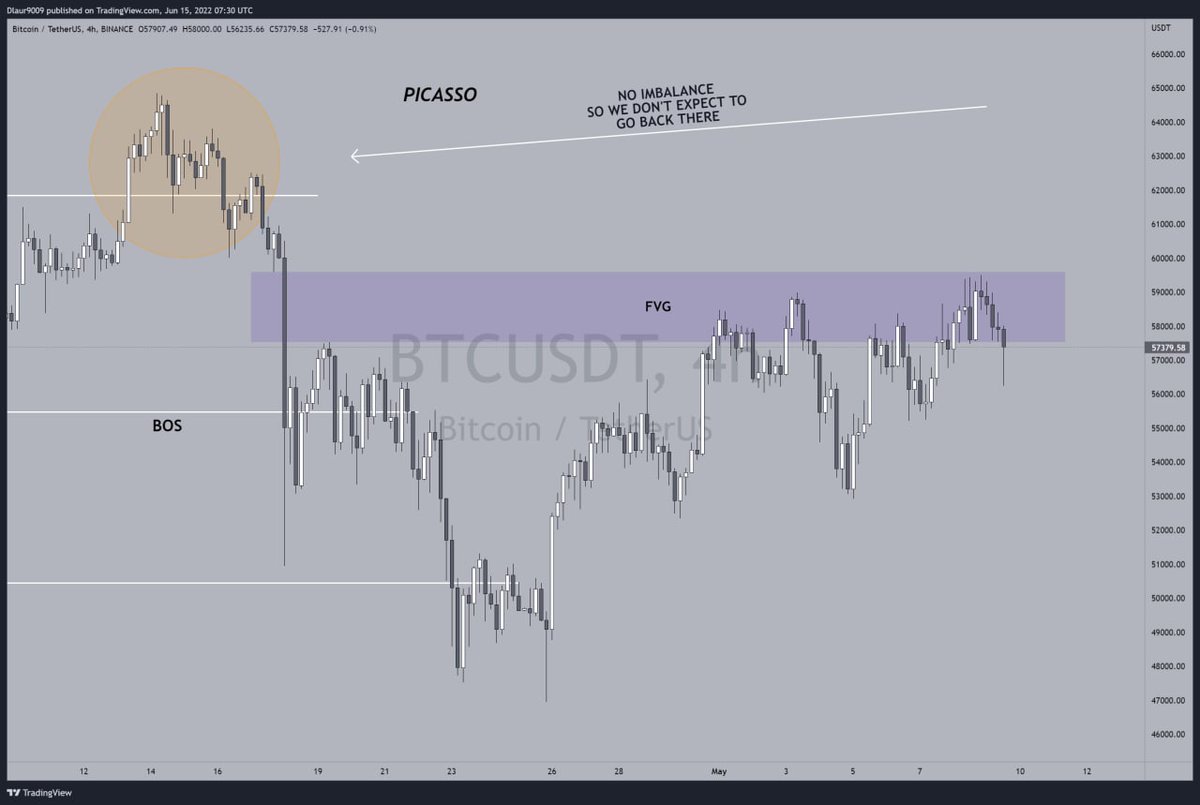
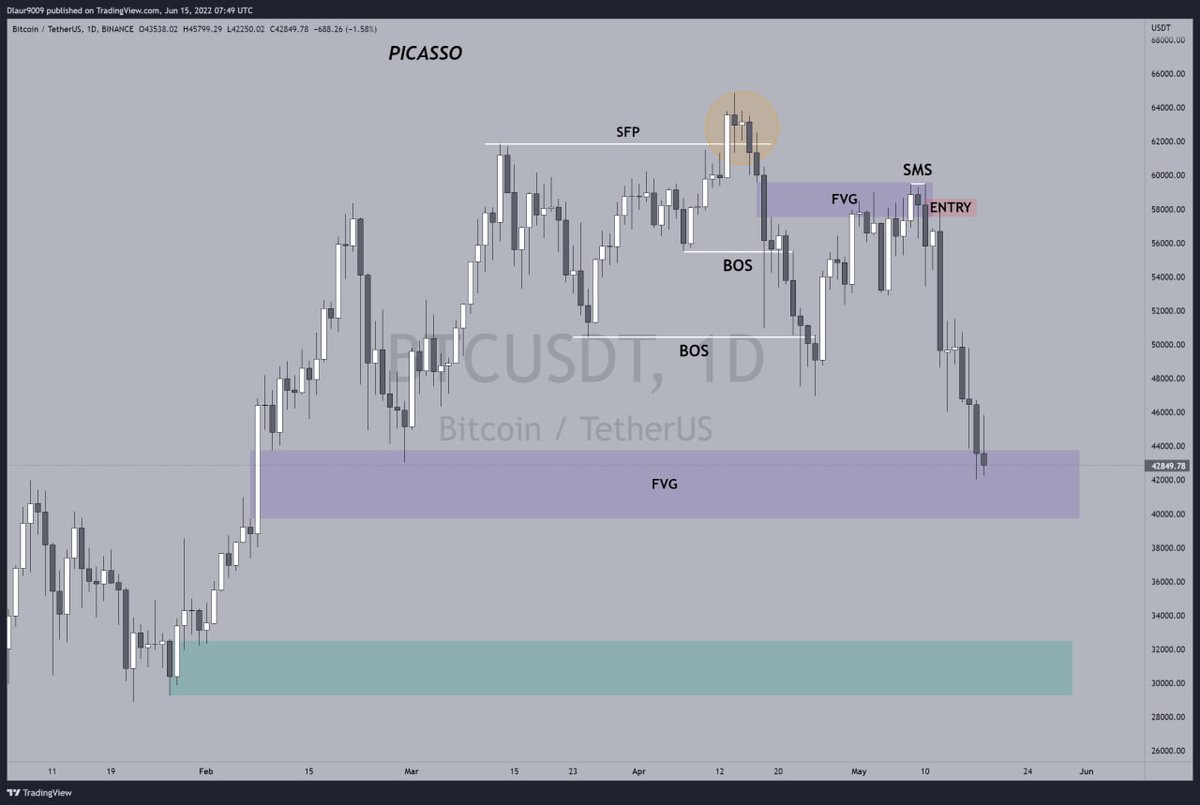
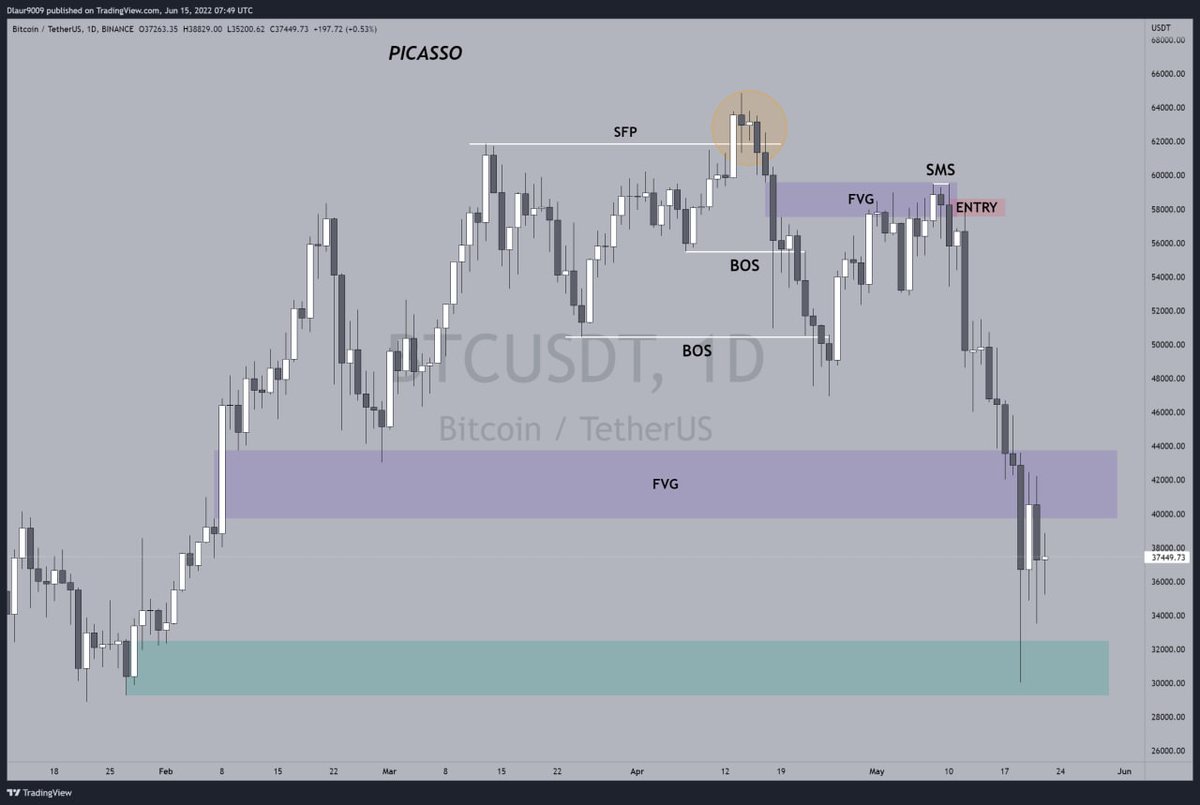
D1
The SFP and BOS are even more visible here which confirms our bearish bias.
The yellow circle suggests that there's been a balance of buying and selling activities in that zone so market makers may only push price to the fair value gap above.
The SFP and BOS are even more visible here which confirms our bearish bias.
The yellow circle suggests that there's been a balance of buying and selling activities in that zone so market makers may only push price to the fair value gap above.
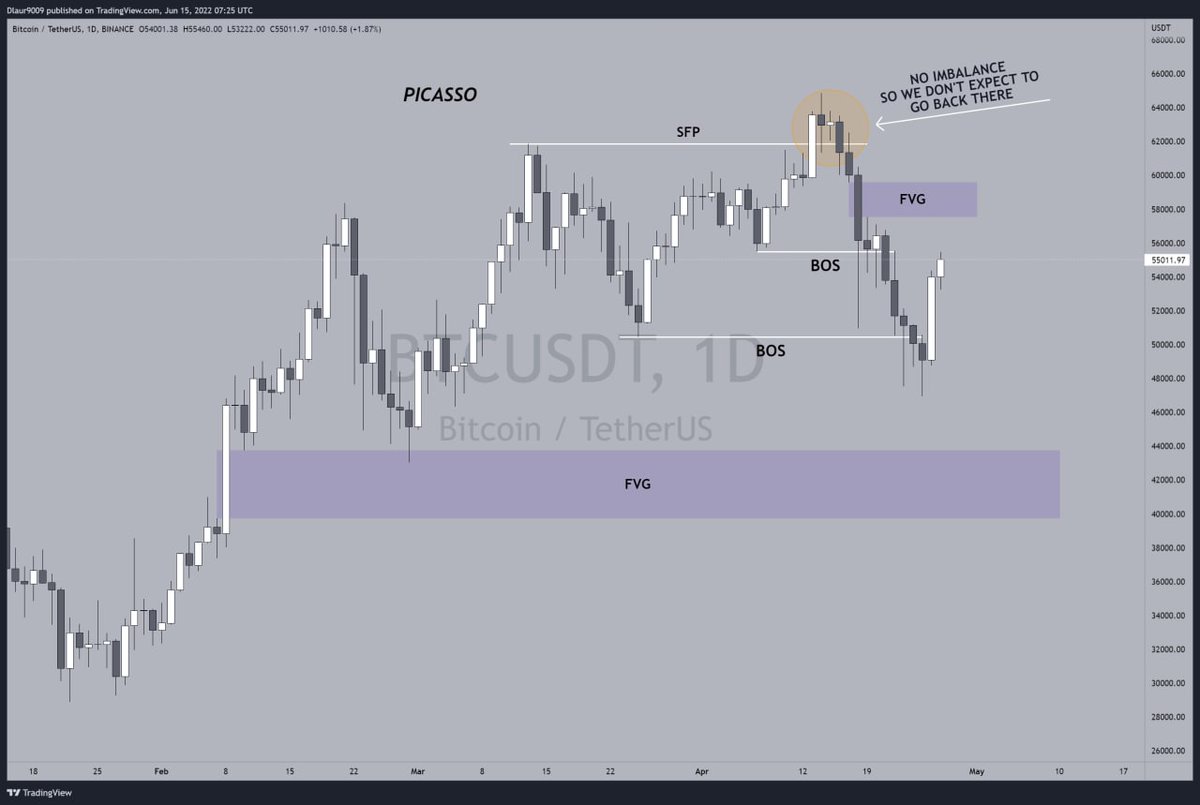
So we want to sell/short from the FVG above.
FVG below on the daily acts as our 1st target for the move.
FVG below on the daily acts as our 1st target for the move.
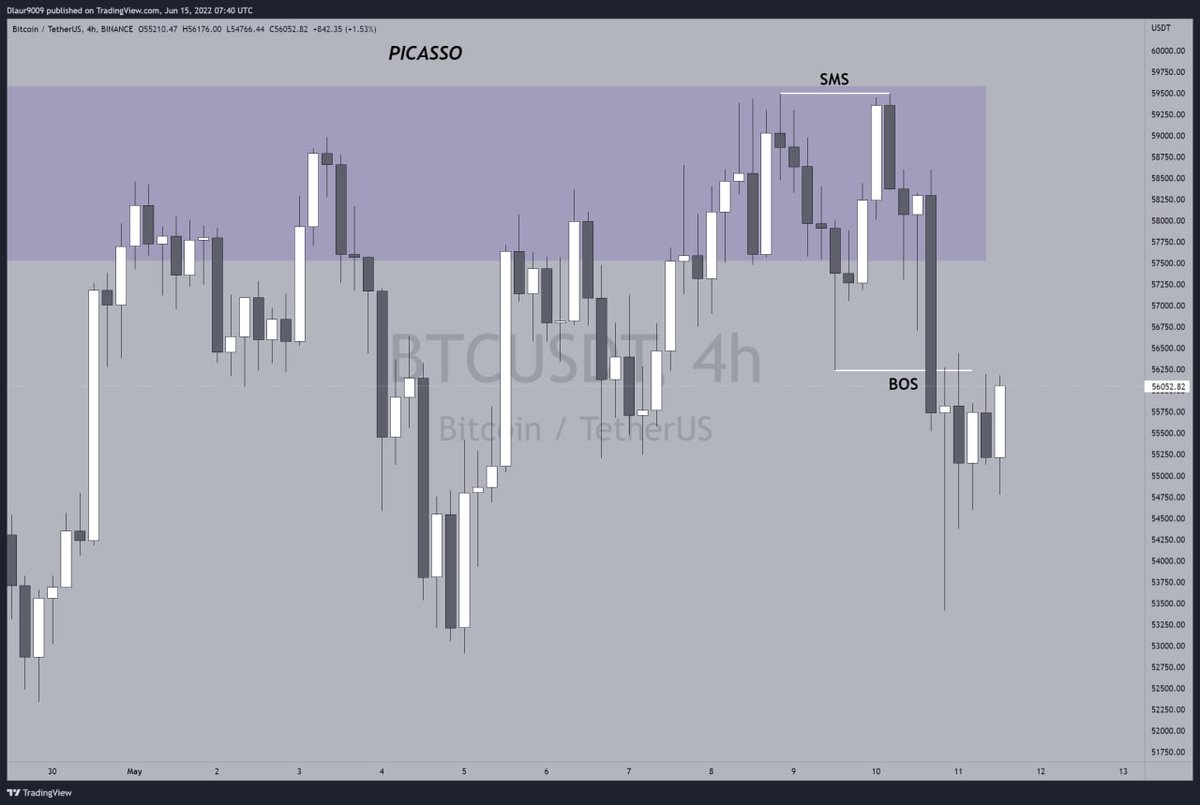
H4
Now we move down to the 4hr and wait for a reaction from price at the FVG, as we find an entry.
Now we move down to the 4hr and wait for a reaction from price at the FVG, as we find an entry.
Fvg gets fully priced, we have price at a valid zone now, so we wait for the market to give us a valid signal.
A shift in Market structure followed by a break in Market structure gives us the sell signal, then we wait for entry at the lower time frame.
A shift in Market structure followed by a break in Market structure gives us the sell signal, then we wait for entry at the lower time frame.
Entry made at the 1hr supply zone.
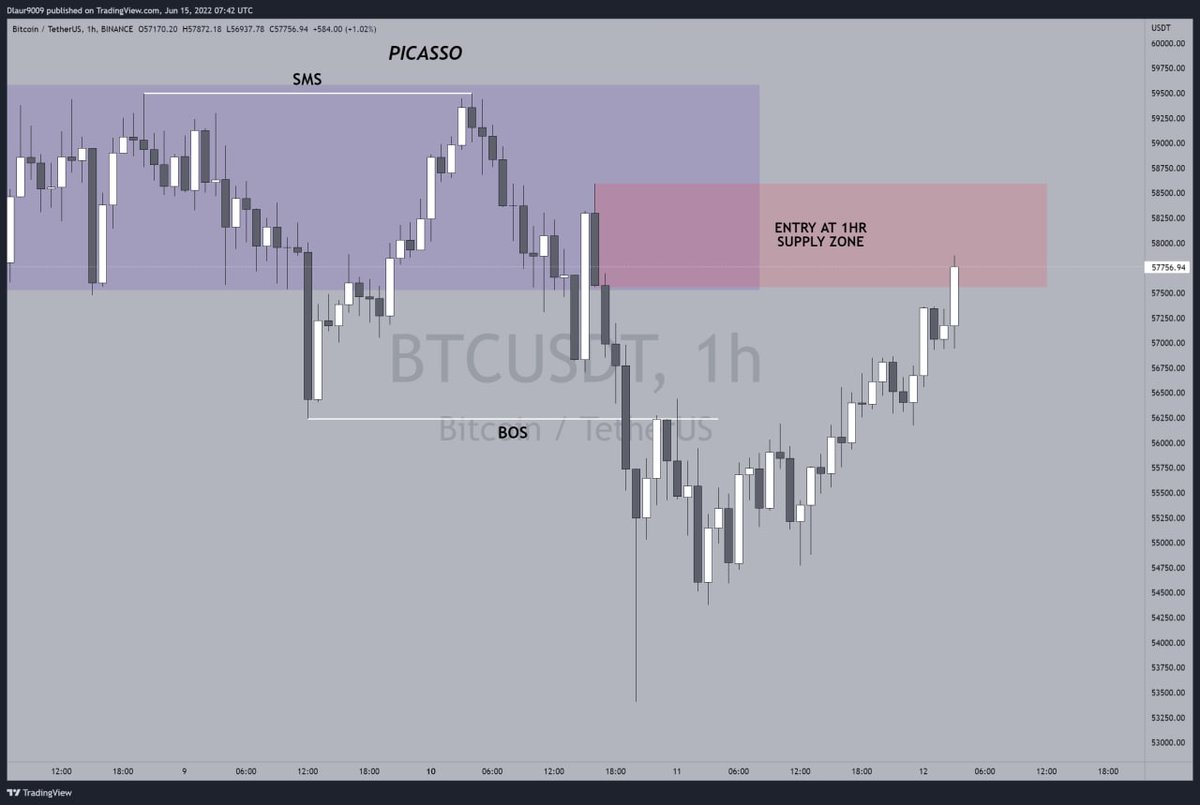
We got our entry at a lower time frame, but don't forget that this is a higher time frame move, so the higher time frame will determine our target.
Note: I didn't take this particular trade because I wasn't well knowledgeable as at the time.
Case study: #ETH
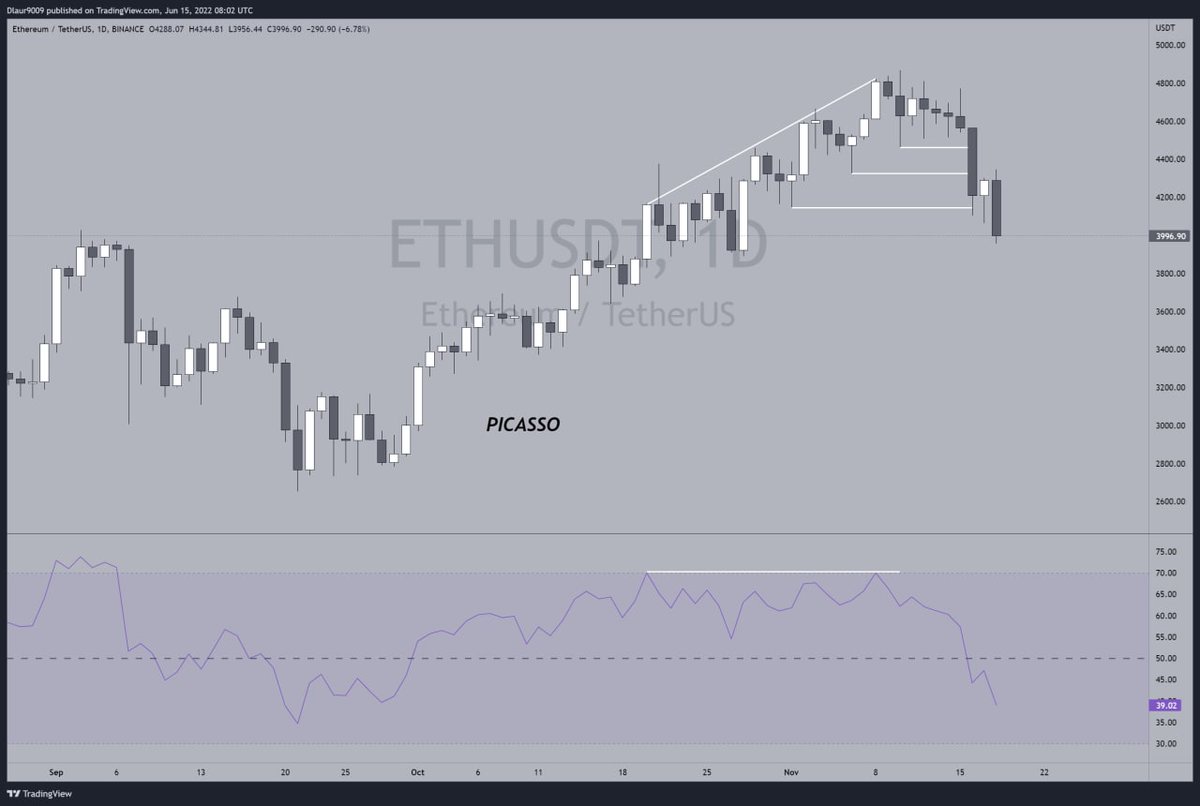
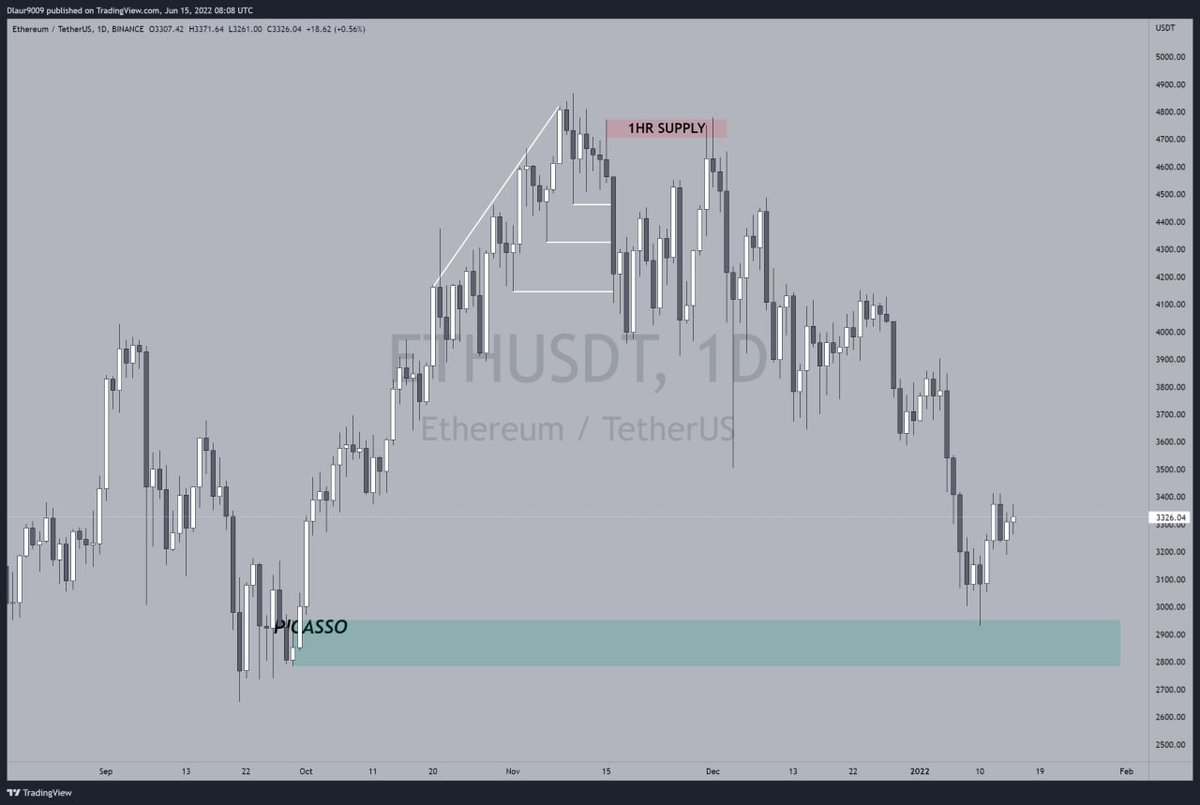
D1
RSI bearish divergence suggests a weak uptrend. Price taking out multiple lows gives us confirmation on our bias.
D1
RSI bearish divergence suggests a weak uptrend. Price taking out multiple lows gives us confirmation on our bias.
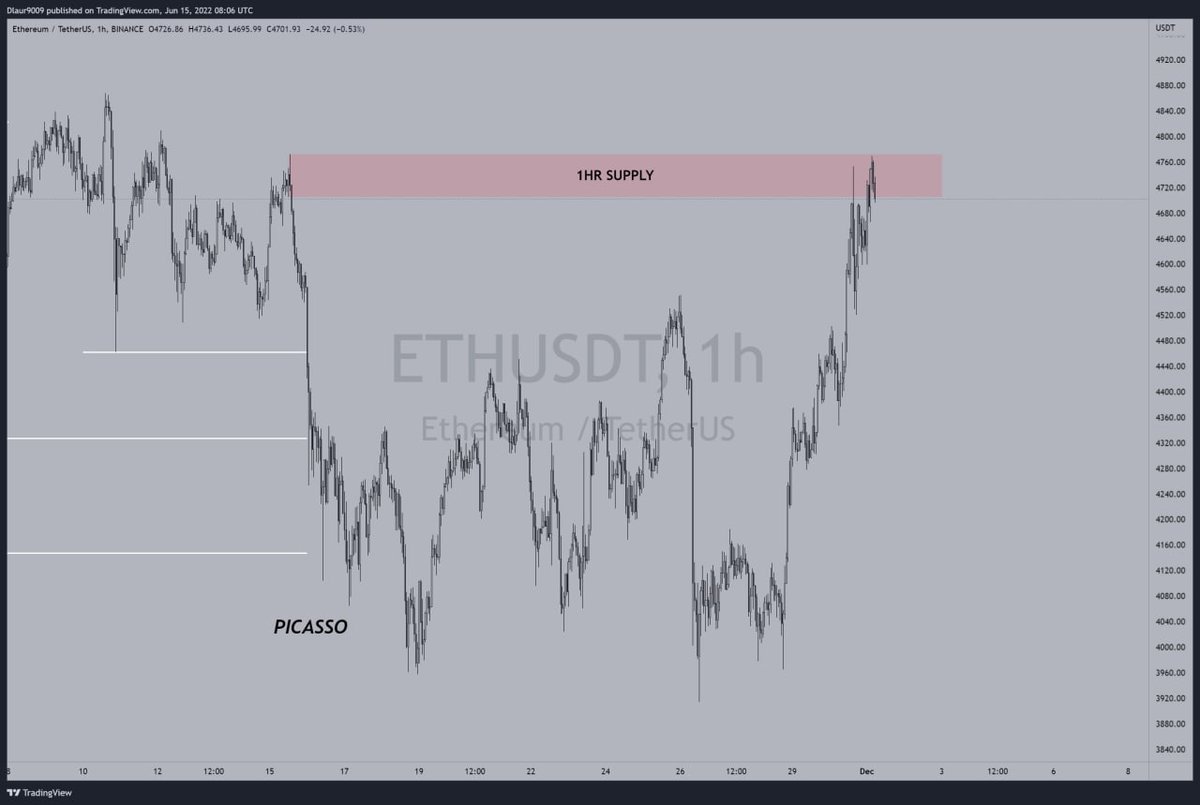
H4
On the 4 hour time frame we identify a supply zone suitable for a short entry.
On the 4 hour time frame we identify a supply zone suitable for a short entry.
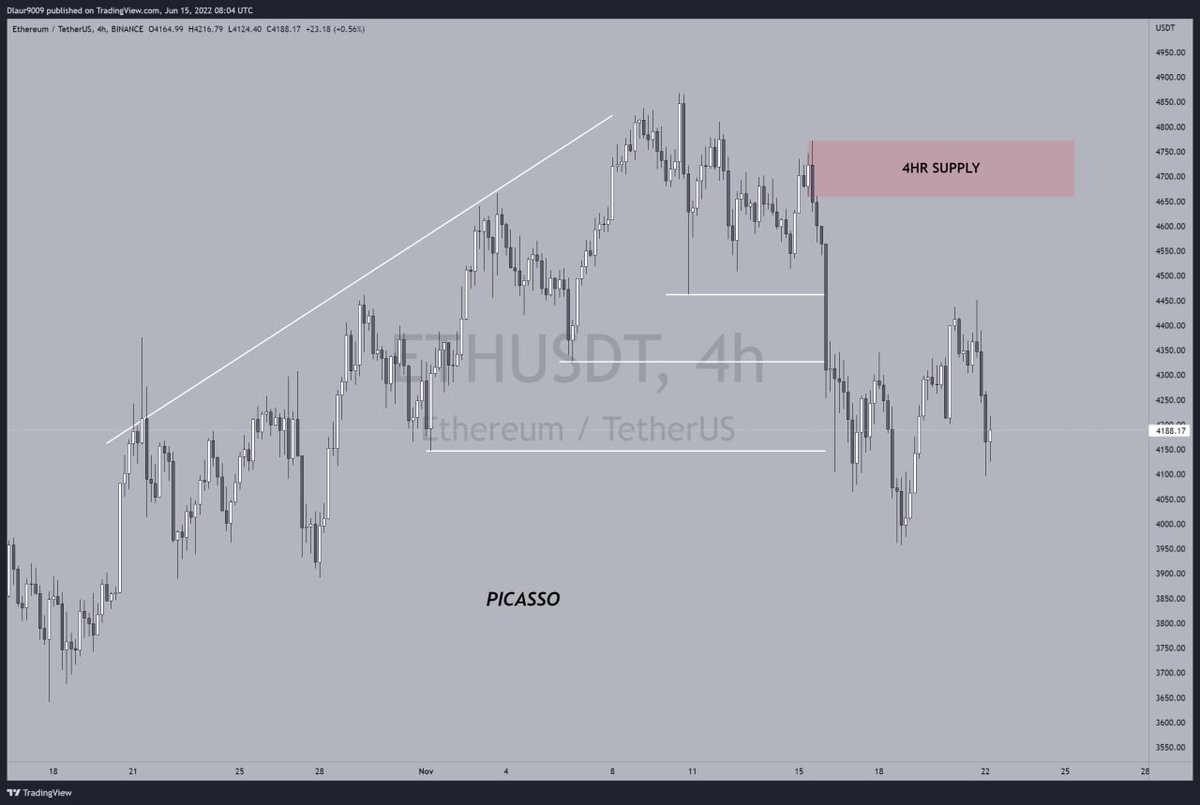
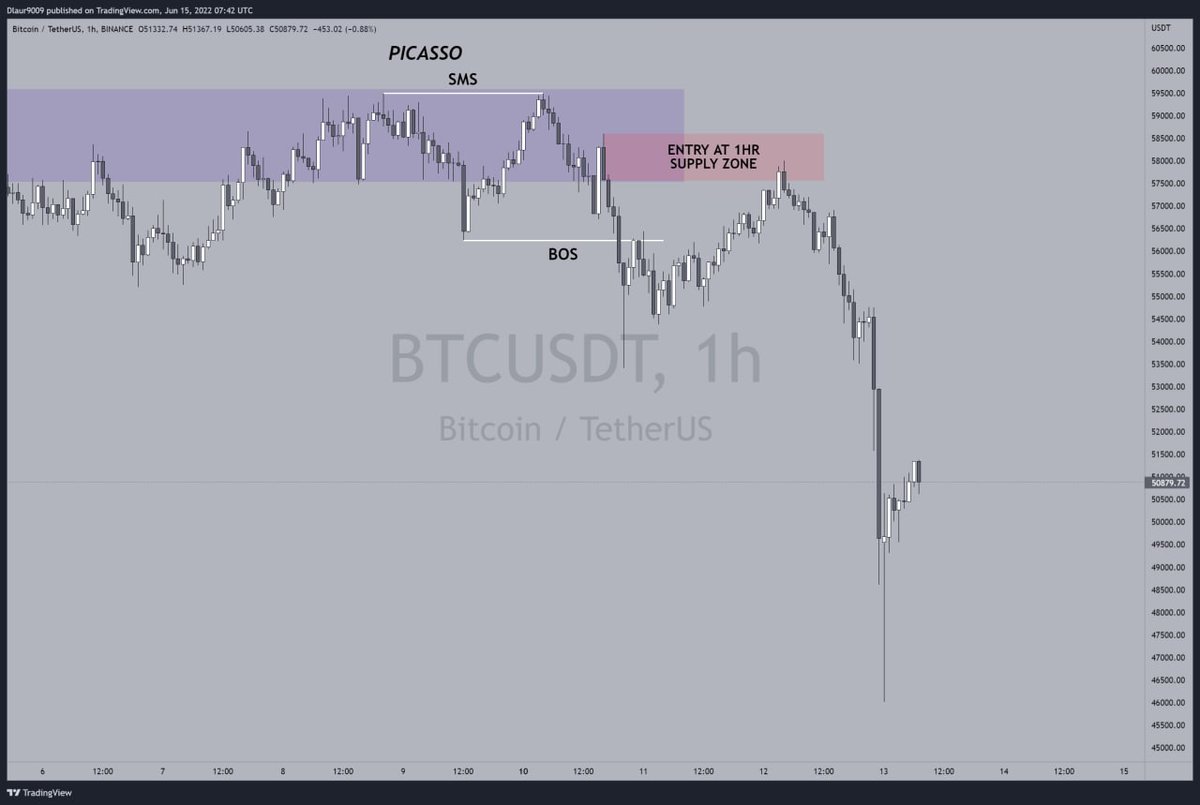
Price comes back to the identified supply zone, which has now been refinedon the H1 time frame, then we make a short entry.
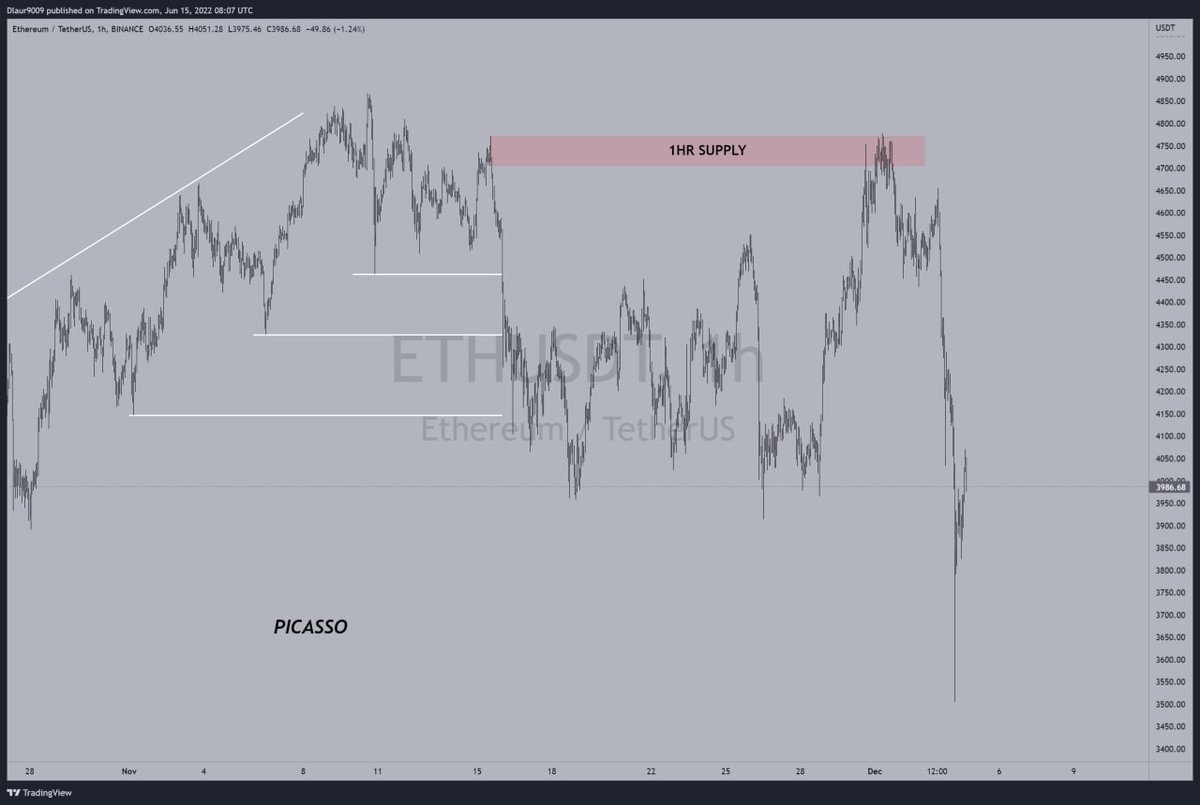
Price runs away from the zone to a higher time frame target.
These are just 2 examples but the lessons in them can be used anywhere.
I hope you got value from this piece.
Kindly follow me for more of these.
Like, retweet and share this tweet so other people who need it would learn as well.
Peace.
✌
I hope you got value from this piece.
Kindly follow me for more of these.
Like, retweet and share this tweet so other people who need it would learn as well.
Peace.
✌
Here's a thread of all my Educational threads.
جاري تحميل الاقتراحات...