

This learning thread would be on
"Central Pivot Range—(𝘾𝙋𝙍)"
- What is CPR?
- How do we use CPR?
- How to analyse trend using CPR?
- Trading setup for CPR?
Let's Start
#CPR #Trading #Nifty #OptionsTrading #banknifty #Trader #tradingstrategy
"Central Pivot Range—(𝘾𝙋𝙍)"
- What is CPR?
- How do we use CPR?
- How to analyse trend using CPR?
- Trading setup for CPR?
Let's Start
#CPR #Trading #Nifty #OptionsTrading #banknifty #Trader #tradingstrategy
What is Central Pivot Range (CPR)?
It is an indicator to identify key price points to set up trades.
3 lines are plotted on the chart when we plot CPR.
The CPR consists of three components –
1. Top Central Pivot (TC)
2. Pivot
3. Bottom Central Pivot (BC)
It is an indicator to identify key price points to set up trades.
3 lines are plotted on the chart when we plot CPR.
The CPR consists of three components –
1. Top Central Pivot (TC)
2. Pivot
3. Bottom Central Pivot (BC)
Calculation of the levels:
TC = (Pivot – BC) + Pivot
Pivot = (High + Low + Close)/3
BC = (High + Low)/2
These are simple averages and manipulation to the averages.
It helps the trader identify key price points and the associated trend around these price points.
TC = (Pivot – BC) + Pivot
Pivot = (High + Low + Close)/3
BC = (High + Low)/2
These are simple averages and manipulation to the averages.
It helps the trader identify key price points and the associated trend around these price points.
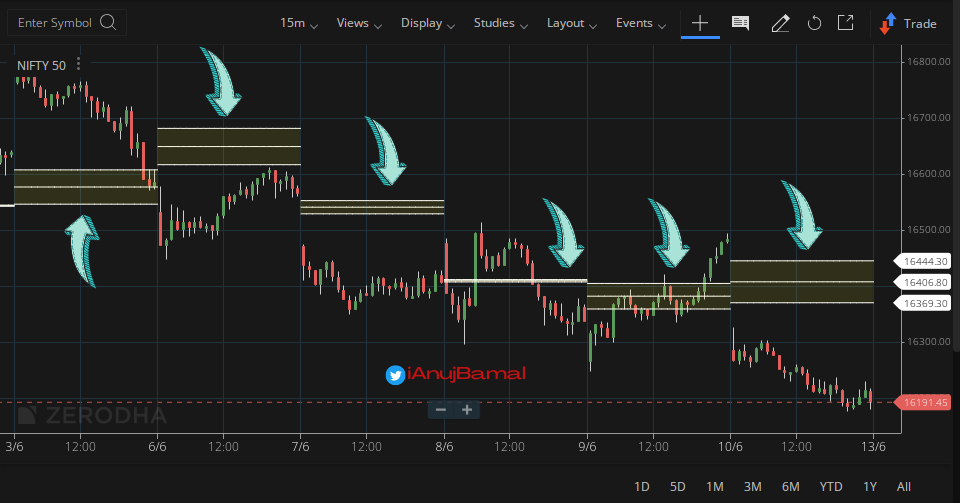
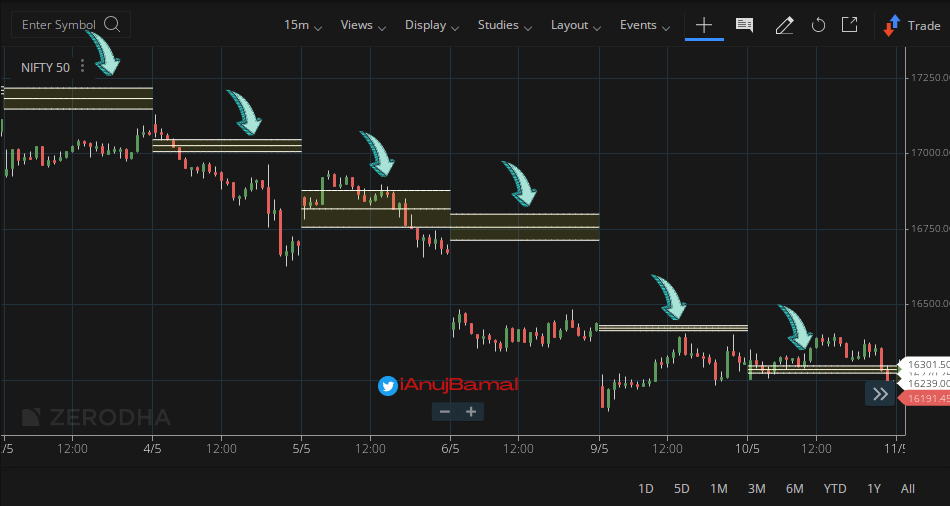
I’ve marked all the CPR on the chart to discuss this.
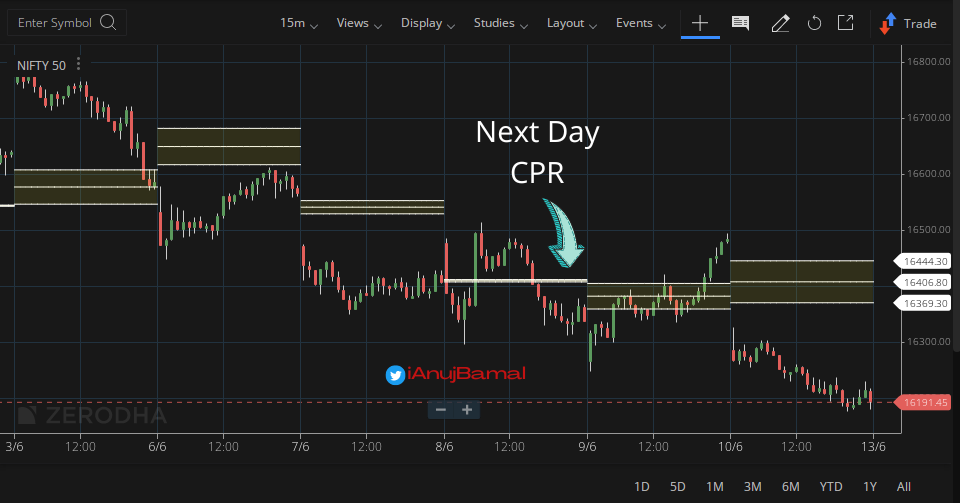
Look at the 3rd arrow starting from left, ignore the CPR but look at the price action itself. Day started with a Red candle with not much movement through the day.
The open and close were close to each other.
Look at the 3rd arrow starting from left, ignore the CPR but look at the price action itself. Day started with a Red candle with not much movement through the day.
The open and close were close to each other.
Whenever, we have a sideways movement, the next day’s CPR narrow ranged, this is exactly what we observe on the next day.
Let's see another scenario
Let's see another scenario
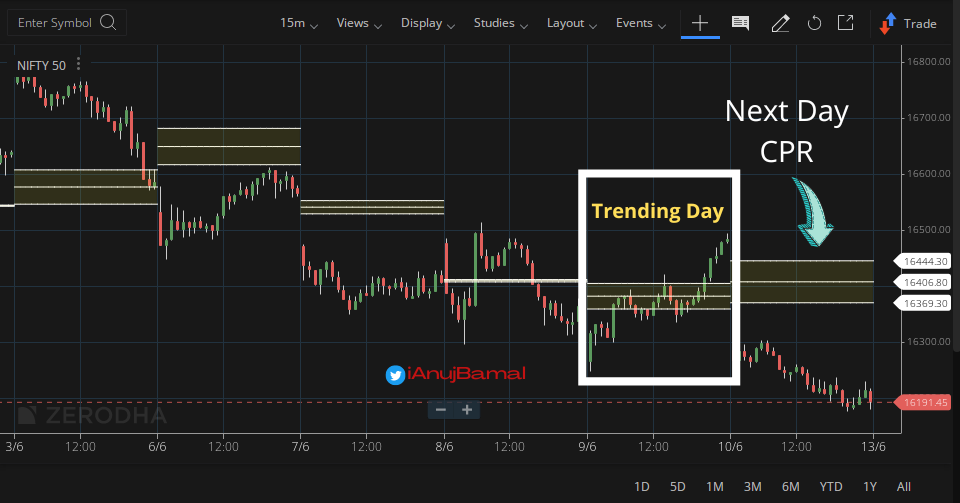
Now this marked day was trending day. Hence the CPR for Next day was a wide-ranged one.
So the point is-
If today is a narrow range day, tomorrow’s CPR will be a narrow ranged CPR.
If it is a trending day, next day CPR is a wide-ranged one.
"Higher the trend, wider is the CPR"
So the point is-
If today is a narrow range day, tomorrow’s CPR will be a narrow ranged CPR.
If it is a trending day, next day CPR is a wide-ranged one.
"Higher the trend, wider is the CPR"
How do we use the CPR?
CPR can be used in finding trend.
If CPR is moving down for the next day, then trend is down.
If CPR is moving up for the next day, then trend is up.
Example:
In the below chart of Nifty (15 mins), CPR is moving down and price is also in downtrend.
CPR can be used in finding trend.
If CPR is moving down for the next day, then trend is down.
If CPR is moving up for the next day, then trend is up.
Example:
In the below chart of Nifty (15 mins), CPR is moving down and price is also in downtrend.
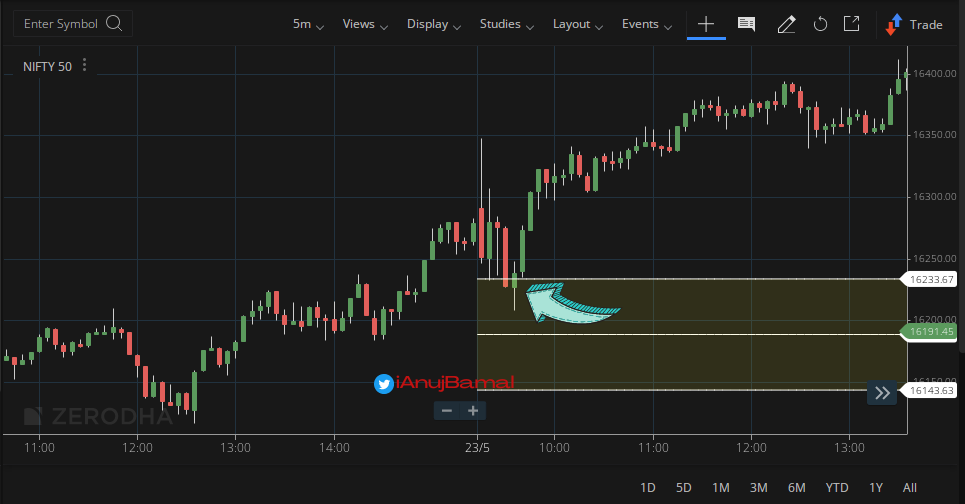
Bullish outlook
Assume #Nifty has rallied for a bit. The current price is higher than the TC, & you are looking for an opportunity to set up a buy trade.
You can now wait till the Nifty arrests its rally and retraces back to the TC line.
I’ve highlighted a possible opportunity
Assume #Nifty has rallied for a bit. The current price is higher than the TC, & you are looking for an opportunity to set up a buy trade.
You can now wait till the Nifty arrests its rally and retraces back to the TC line.
I’ve highlighted a possible opportunity
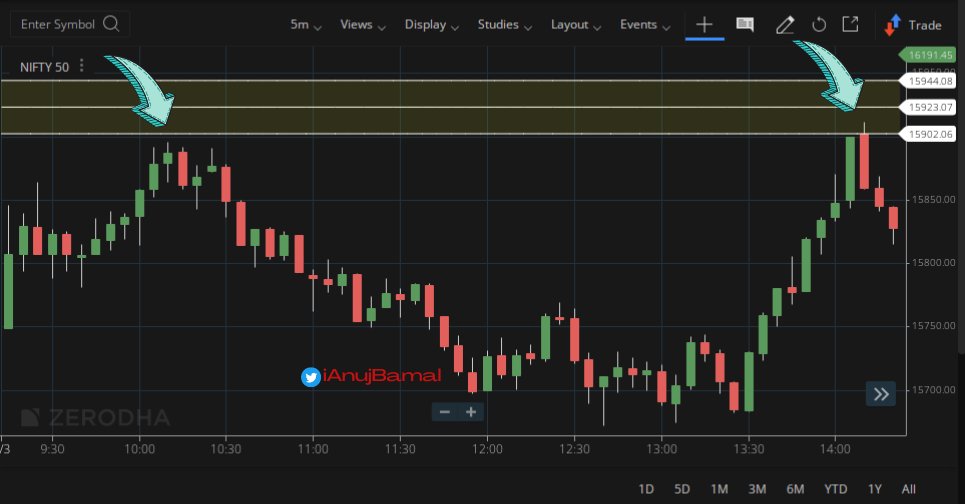
Likewise, when the #Nifty is trading lesser than the BC.
When the current price is less than that BC, it implies that there is bearishness in the market, hence look for selling opportunities.
Again, look for a price pull back to the BC line before initiating a fresh short.
When the current price is less than that BC, it implies that there is bearishness in the market, hence look for selling opportunities.
Again, look for a price pull back to the BC line before initiating a fresh short.
#Trading Setup for CPR
- Use 5 mins time frame.
- If price is above CPR then wait for the retest. If price retest CPR and forms bullish candle (hammer, engulfing) then go long.
- If price is Below CPR then wait for the retest, if it forms Bearish Candle then go Short.
(1/2)
- Use 5 mins time frame.
- If price is above CPR then wait for the retest. If price retest CPR and forms bullish candle (hammer, engulfing) then go long.
- If price is Below CPR then wait for the retest, if it forms Bearish Candle then go Short.
(1/2)
- Stoploss (for long trade) will be candle's low or just below the lowest CPR.
- If market goes in your favor, you can book half quantity and Use Trailing Stoploss for remaining to get out the max profit from it.
(2/2)
- If market goes in your favor, you can book half quantity and Use Trailing Stoploss for remaining to get out the max profit from it.
(2/2)
How to analyze trend based on the candle forming either above or below the daily & weekly CPR?
- Candles below daily & weekly CPR = BEAR
- Candles above daily CPR but below weekly CPR is early confirmation of BULL
- Candles above daily + weekly CPR is strong confirmation of BULL
- Candles below daily & weekly CPR = BEAR
- Candles above daily CPR but below weekly CPR is early confirmation of BULL
- Candles above daily + weekly CPR is strong confirmation of BULL
Key Takeaways
- CPR helps you identify the Support & Resistance pattern
- It is considered bullish if the current market price is higher than the TC line.
- It is considered bearish if the current market price below the BC line.
- CPR helps you identify the Support & Resistance pattern
- It is considered bullish if the current market price is higher than the TC line.
- It is considered bearish if the current market price below the BC line.
If you found this useful,
1. Follow me
@iAnujBamal for more of these.
2. RT the tweet below to share this thread with your audience.
1. Follow me
@iAnujBamal for more of these.
2. RT the tweet below to share this thread with your audience.
Loading suggestions...