

We'd begin from "The Basics of Support and Resistance".
Alot of traders and "analysts" have come to despise and downgrade Support and Resistance (for short S/R), but I honestly think it's one of the most Basic but most important concepts in Technical Analysis.
Alot of traders and "analysts" have come to despise and downgrade Support and Resistance (for short S/R), but I honestly think it's one of the most Basic but most important concepts in Technical Analysis.
In this thread, I'm going to be throwing a little light on the topic.
Basically in the context of trading and technical analysis, the term Support means price floor, and resistance means price ceiling. And we know that naturally things stay above the floor and below the ceiling.
Basically in the context of trading and technical analysis, the term Support means price floor, and resistance means price ceiling. And we know that naturally things stay above the floor and below the ceiling.
So we can as well see price that way. In other words we expect price to stay above the Support and below the resistance.
So a Support is a level or zone that holds price up or carries price or a level where price literally finds a Support.
So a Support is a level or zone that holds price up or carries price or a level where price literally finds a Support.
And quite literally a resistance is a level or zone that price finds a resistance, or a level that opposes and or defies price.
To further simplify I'd say, support is a level that prevents price from going below it and resistance prevents price from going above it.
To further simplify I'd say, support is a level that prevents price from going below it and resistance prevents price from going above it.
Another way to address them is demand and Supply zones, where demand is the support zone and resistance is the supply.
Enough of the theory, let's look at some images.
Enough of the theory, let's look at some images.
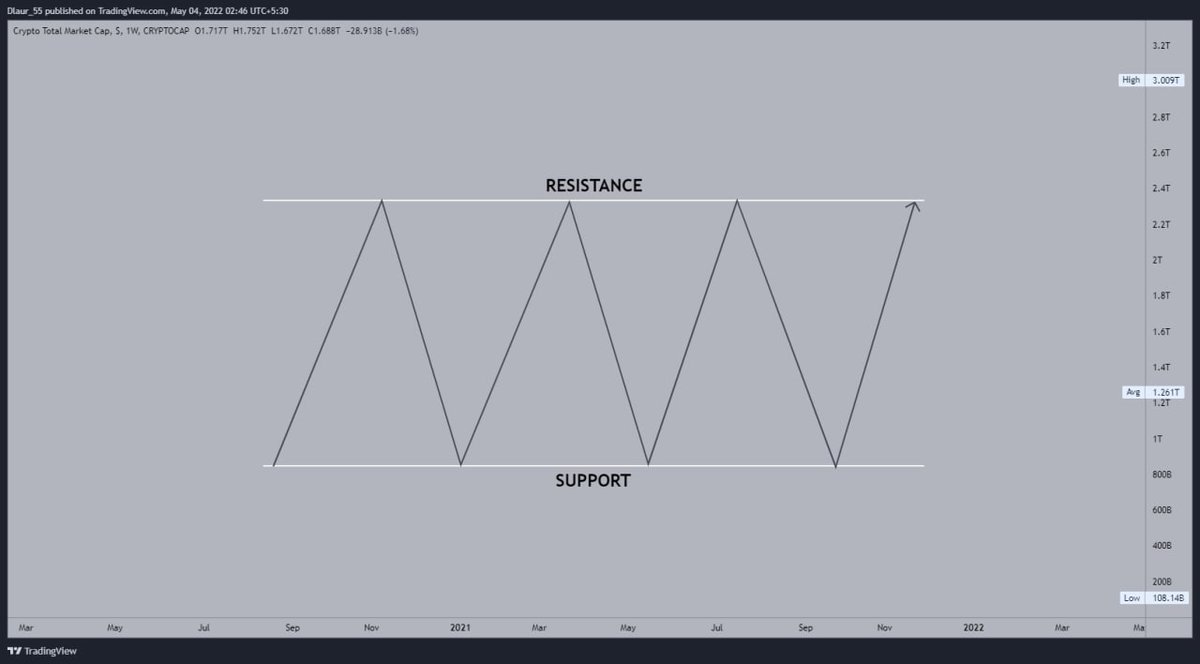
This is a basic representation of Support and Resistance in a ranging market.
This is a basic representation of Support and Resistance in an uptrending and a down trending market.
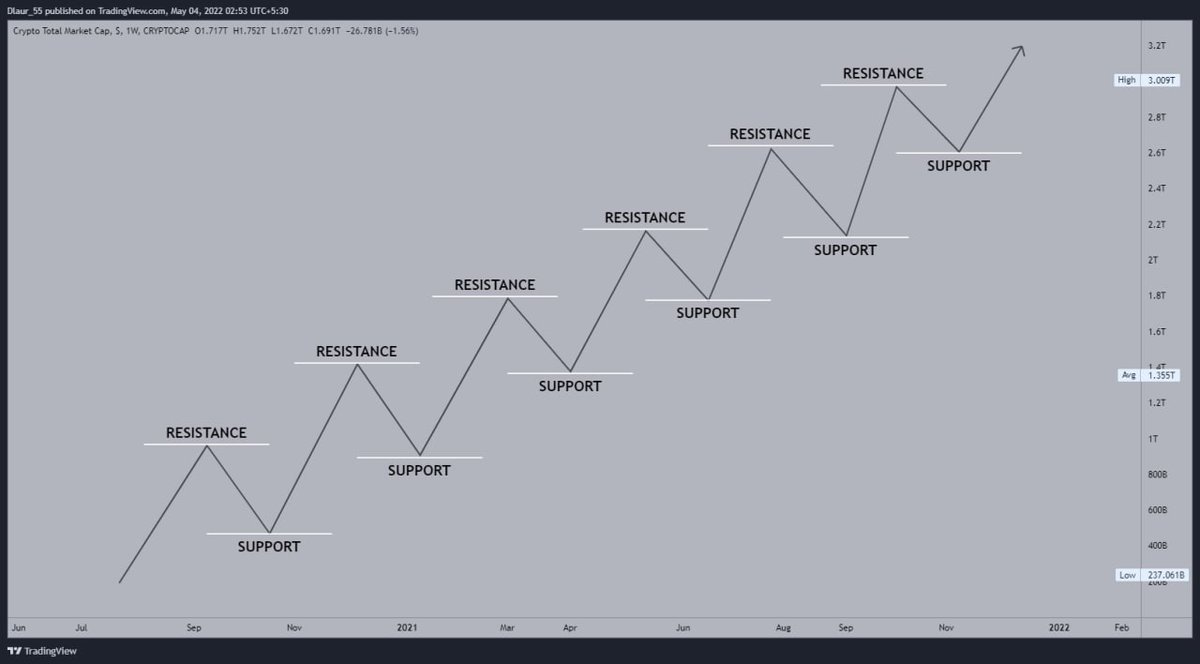
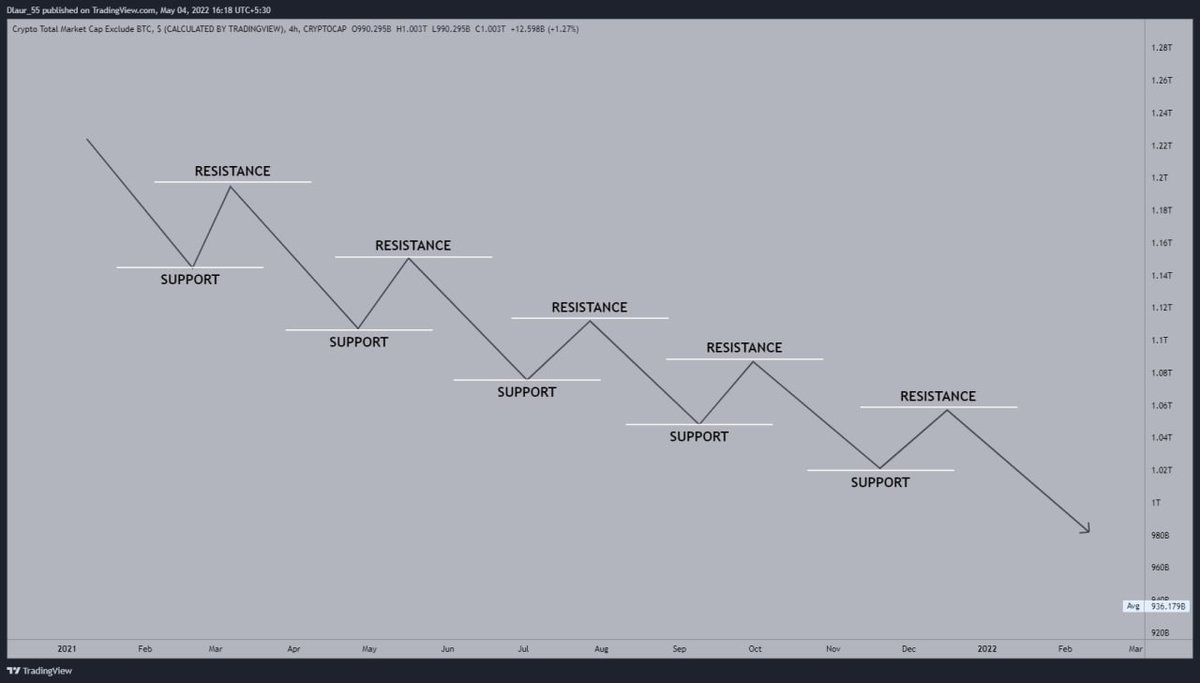
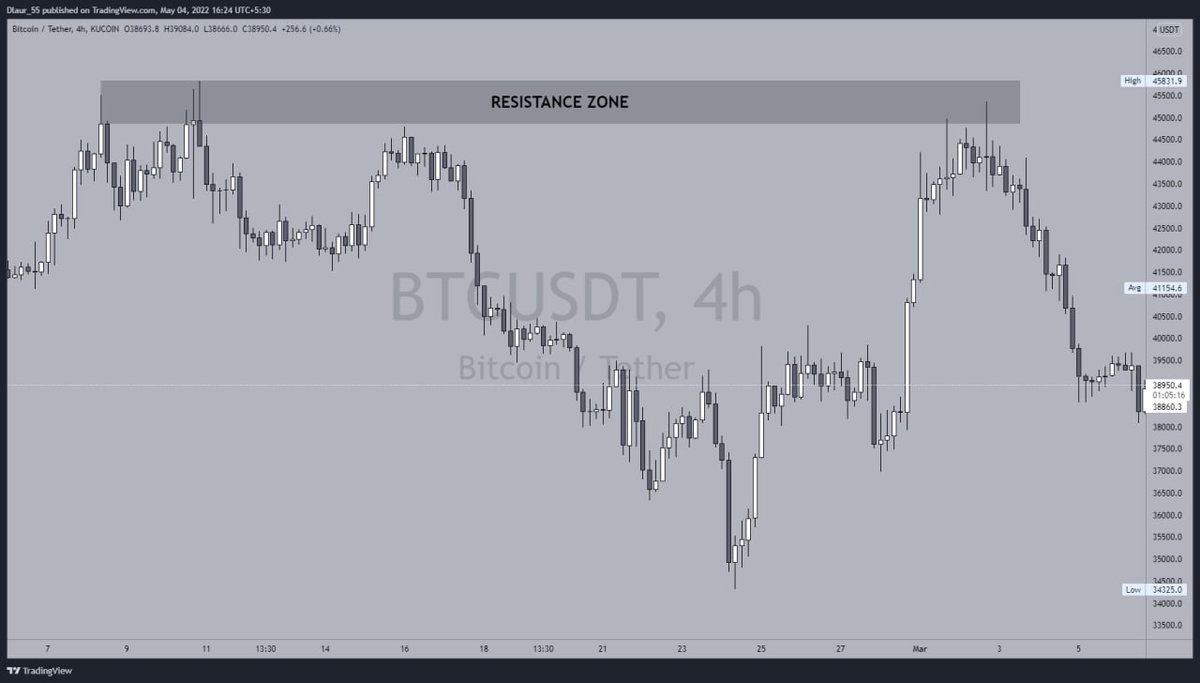
One thing to note is support and resistance aren't necessarily lines and specific numbers, in most cases they're zones.
Take a look at the examples in the images.
Take a look at the examples in the images.
This thread is already getting too long, I'll end with this.
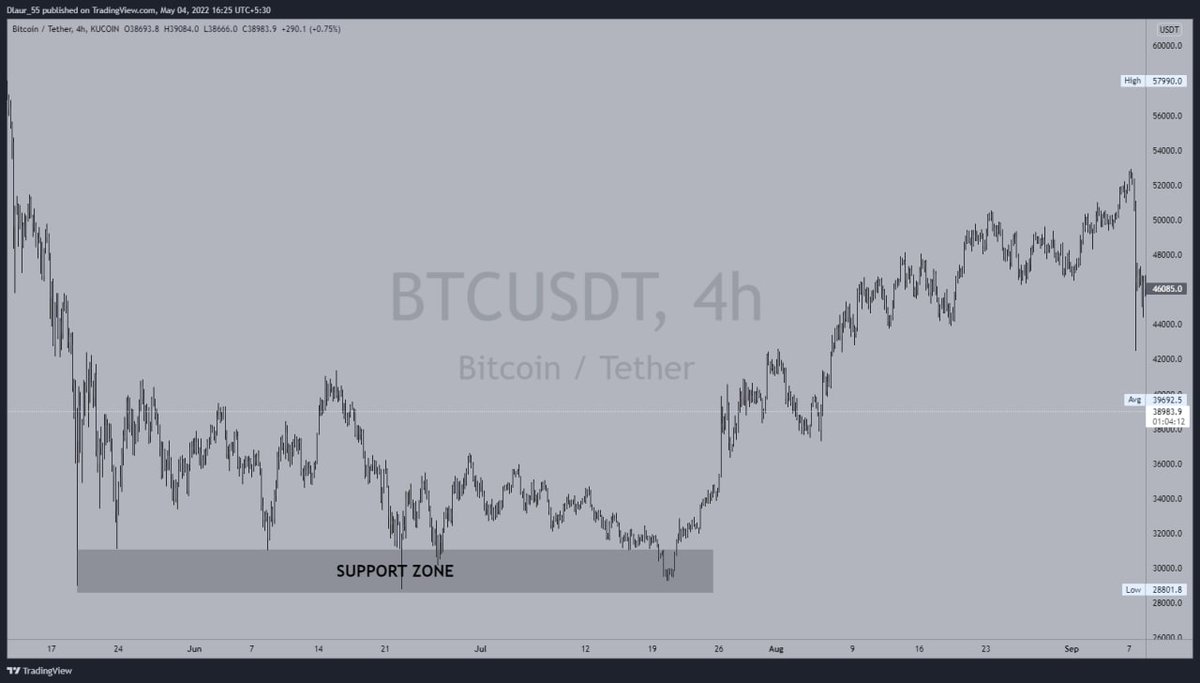
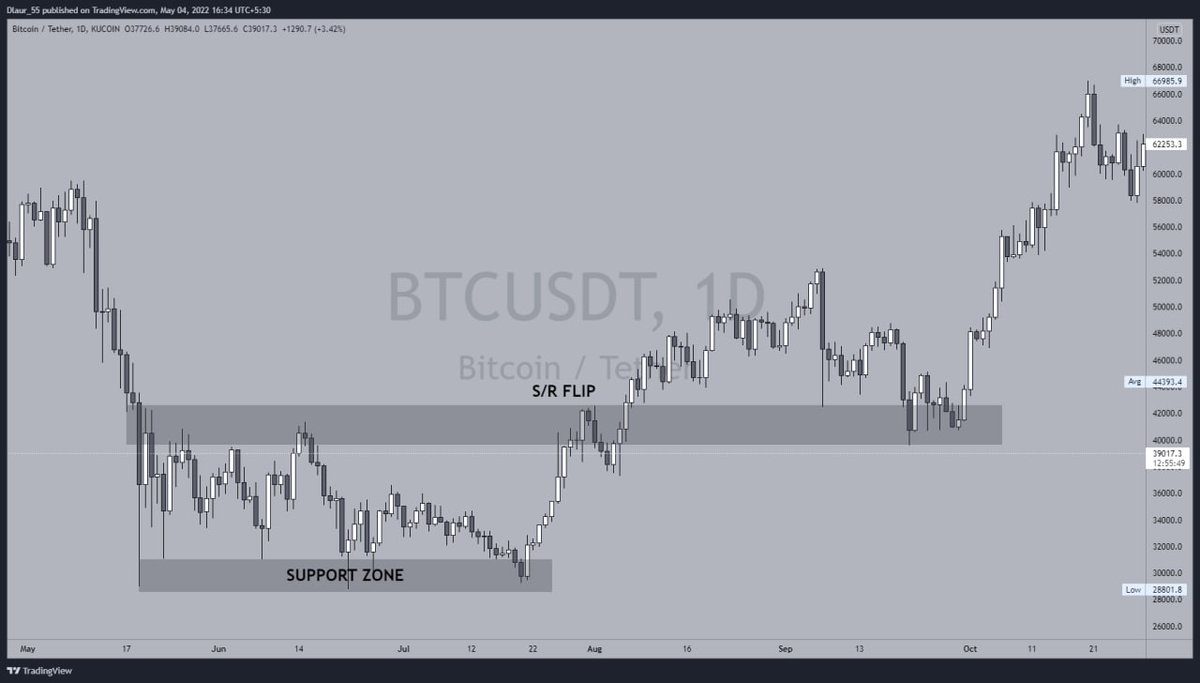
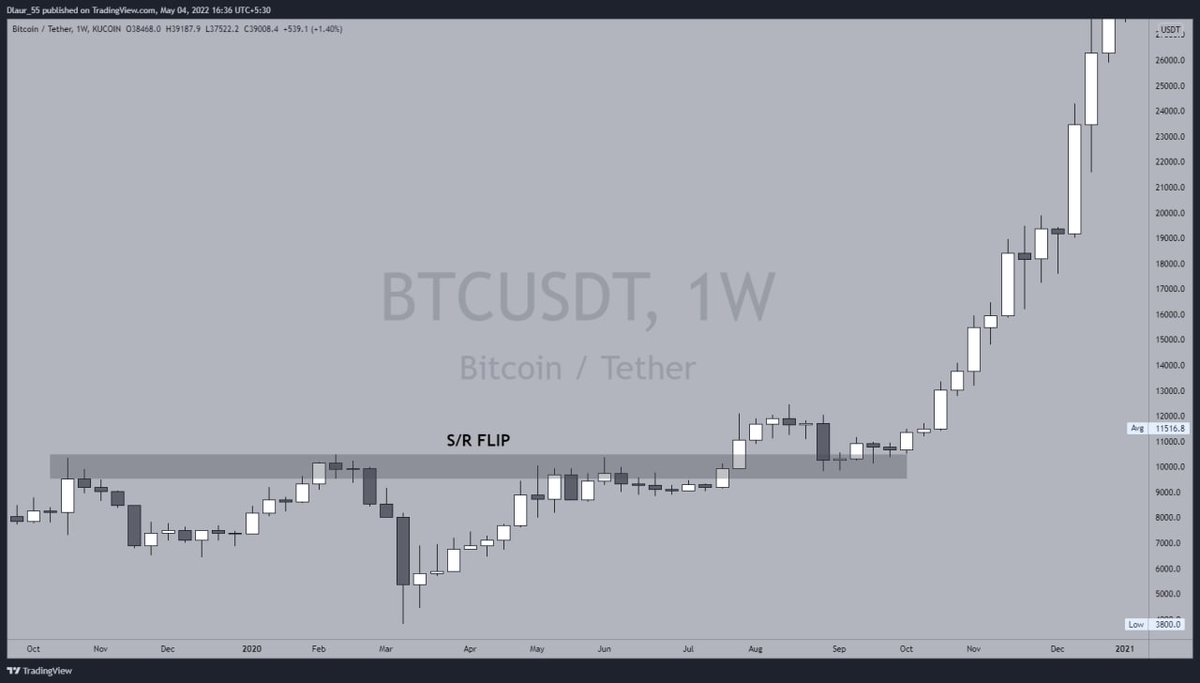
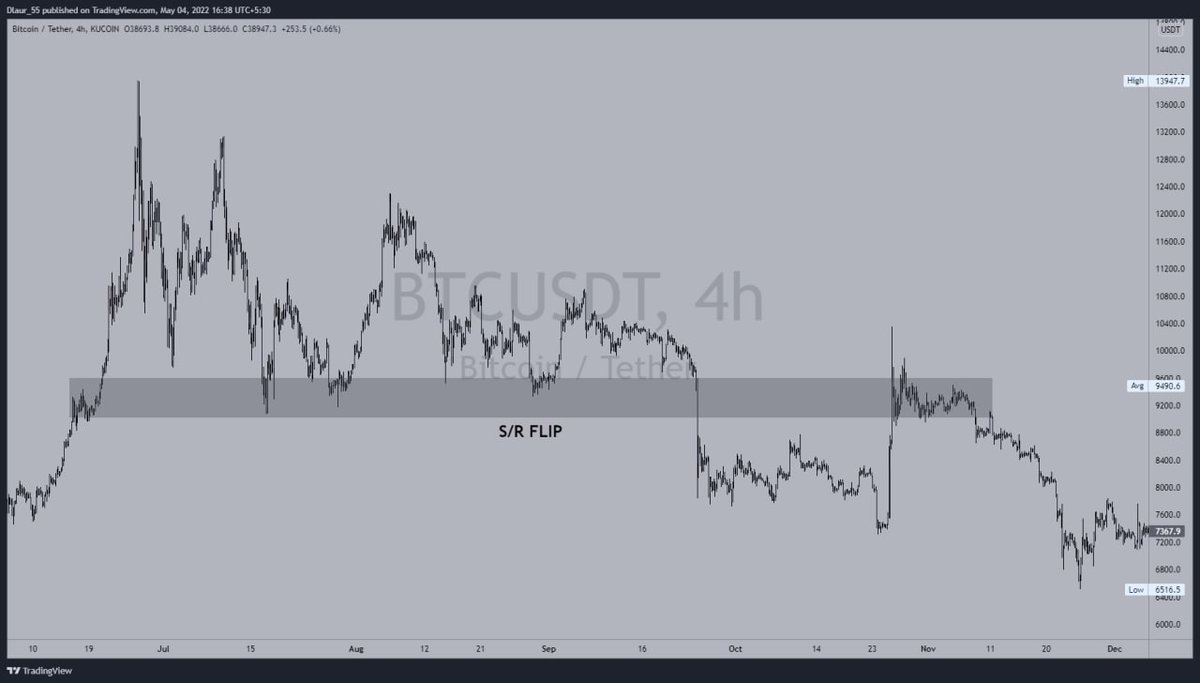
One of the basic rules of Support and Resistance is, when price breaks through a Support or Resistance zone, it flips it and becomes the opposite...
One of the basic rules of Support and Resistance is, when price breaks through a Support or Resistance zone, it flips it and becomes the opposite...
...that is, if a Support is broken, that Support becomes a Resistance and if a Resistance is broken it becomes a Support.
This is known as an S/R flip.
Examples are in the images.
This is known as an S/R flip.
Examples are in the images.
S/R flip on #BTC here, Resistance breaks and becomes Support.

We'd talk about the types of markets in in the next module.
Have a lovely day.
Peace.
✌
Have a lovely day.
Peace.
✌
Loading suggestions...