

Market Structure Mapping Types 📝
Although market structure is market structure, there are 3 different approaches that you can use to map out and identify breaks of structure.
1/4🧵
Although market structure is market structure, there are 3 different approaches that you can use to map out and identify breaks of structure.
1/4🧵
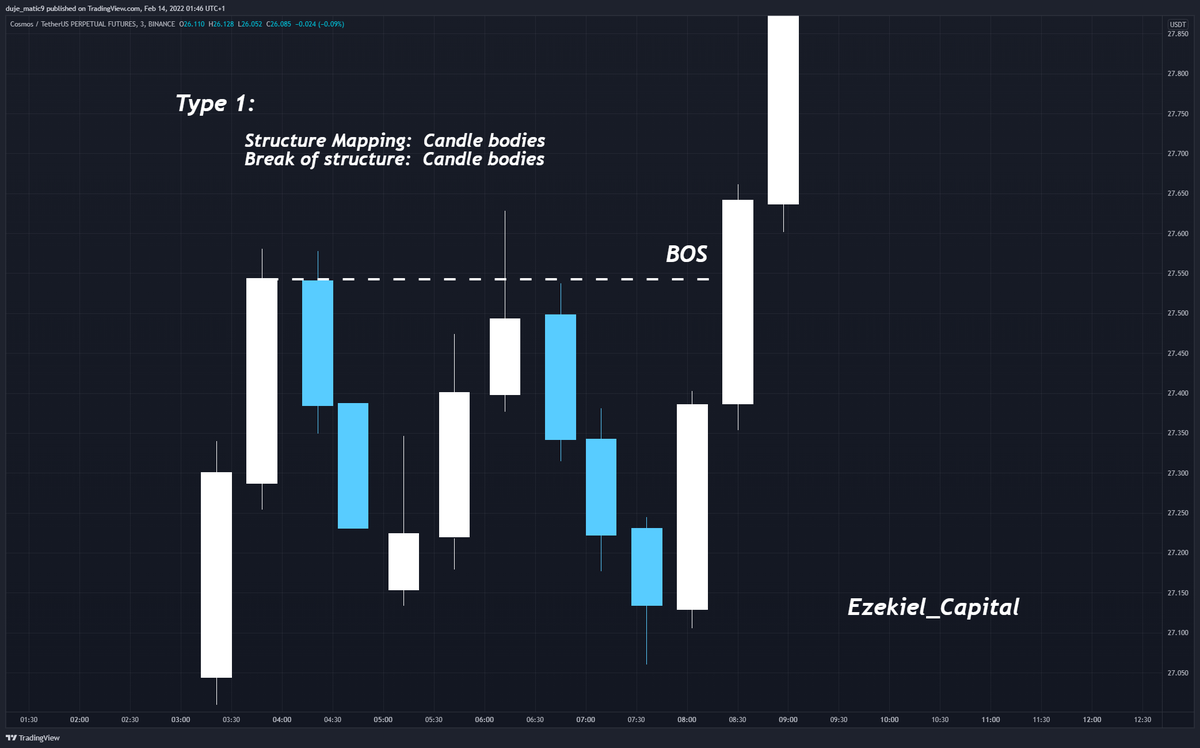
Type 1
⭕️maps market structure using candle bodies and a break of structure is valid when price breaks and closes above/below the previous candle body.
⭕️This is noted as the most conservative approach to mapping out market structure and identifying breaks of structure.
⭕️maps market structure using candle bodies and a break of structure is valid when price breaks and closes above/below the previous candle body.
⭕️This is noted as the most conservative approach to mapping out market structure and identifying breaks of structure.
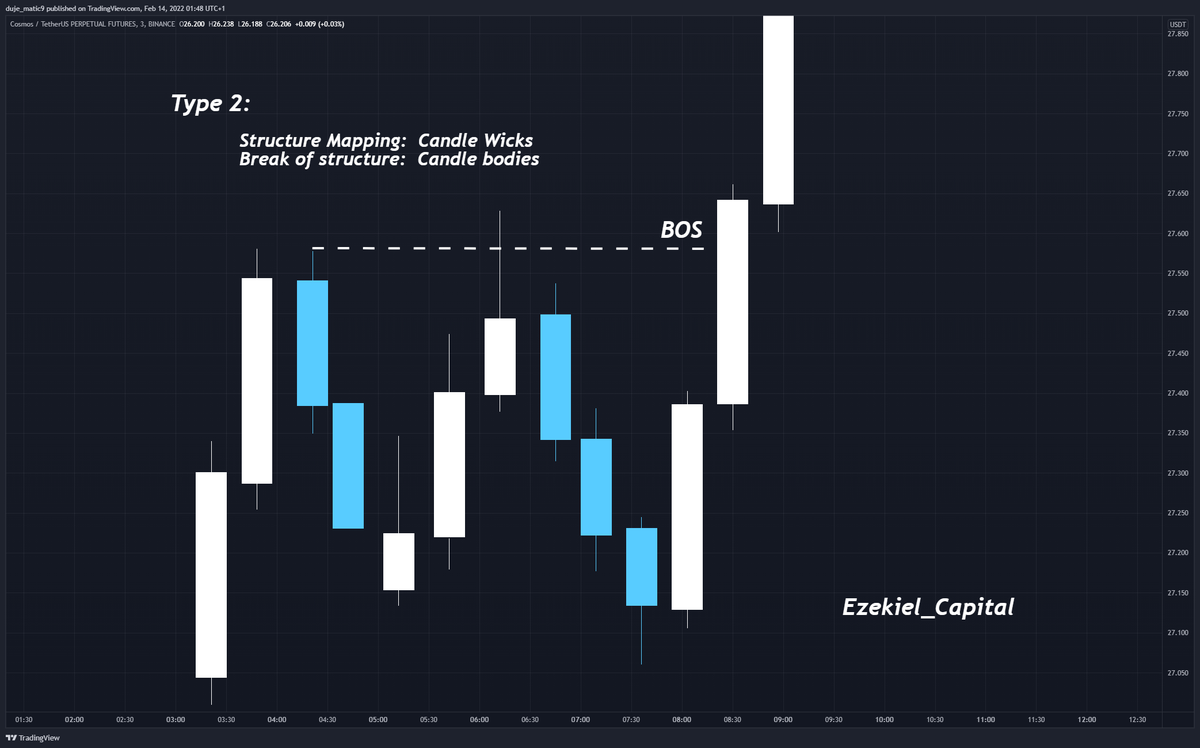
Type 2
⭕️maps market structure using candle wicks and a break of structure is valid when price breaks and closes above/below the previous candle wick.
⭕️ This is the most common approach to mapping out market structure and identifying breaks of structure.
⭕️maps market structure using candle wicks and a break of structure is valid when price breaks and closes above/below the previous candle wick.
⭕️ This is the most common approach to mapping out market structure and identifying breaks of structure.
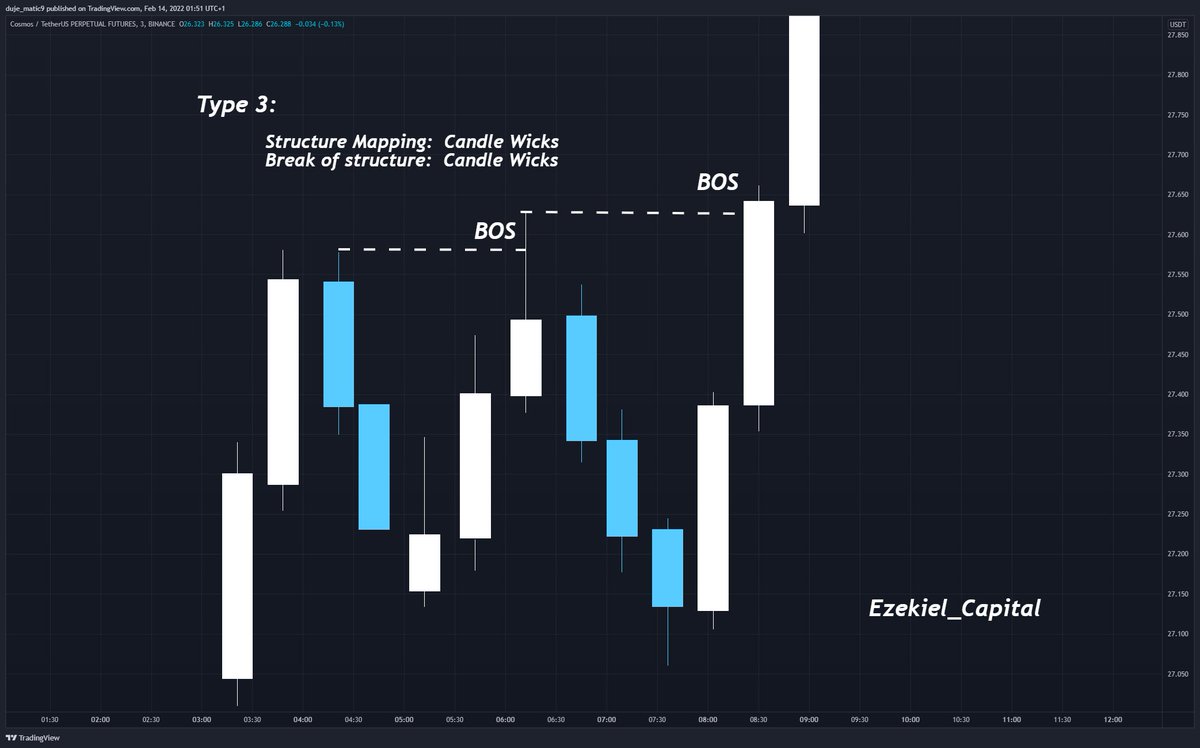
Type 3
⭕️maps market structure using candle wicks and a break of structure is valid when price breaks above/below the previous candle wick.
⭕️This is noted as the most aggressive approach to mapping out market structure and identifying breaks of structure.
⭕️maps market structure using candle wicks and a break of structure is valid when price breaks above/below the previous candle wick.
⭕️This is noted as the most aggressive approach to mapping out market structure and identifying breaks of structure.
4/4💎
Type 1: This is noted as the most conservative approach to mapping out market structure and identifying breaks of structure.
Type 2: It is effectively taking the average of type 1 and 3.
Type 3: There can be many false signals.
Type 1: This is noted as the most conservative approach to mapping out market structure and identifying breaks of structure.
Type 2: It is effectively taking the average of type 1 and 3.
Type 3: There can be many false signals.
Loading suggestions...