


Index
1) Importance of Trend
2) Time Frame Importance
3) Bullish Day Signals
- Candles, VWAP, EMA, Patterns, Resistance BO
4) Bearish Day Signals - In Next Thread Soon
5) Reversal Day Signals - In PDF Only
6) Psychology - In PDF Only
Imp - Explanation in Charts Only
2/10
1) Importance of Trend
2) Time Frame Importance
3) Bullish Day Signals
- Candles, VWAP, EMA, Patterns, Resistance BO
4) Bearish Day Signals - In Next Thread Soon
5) Reversal Day Signals - In PDF Only
6) Psychology - In PDF Only
Imp - Explanation in Charts Only
2/10
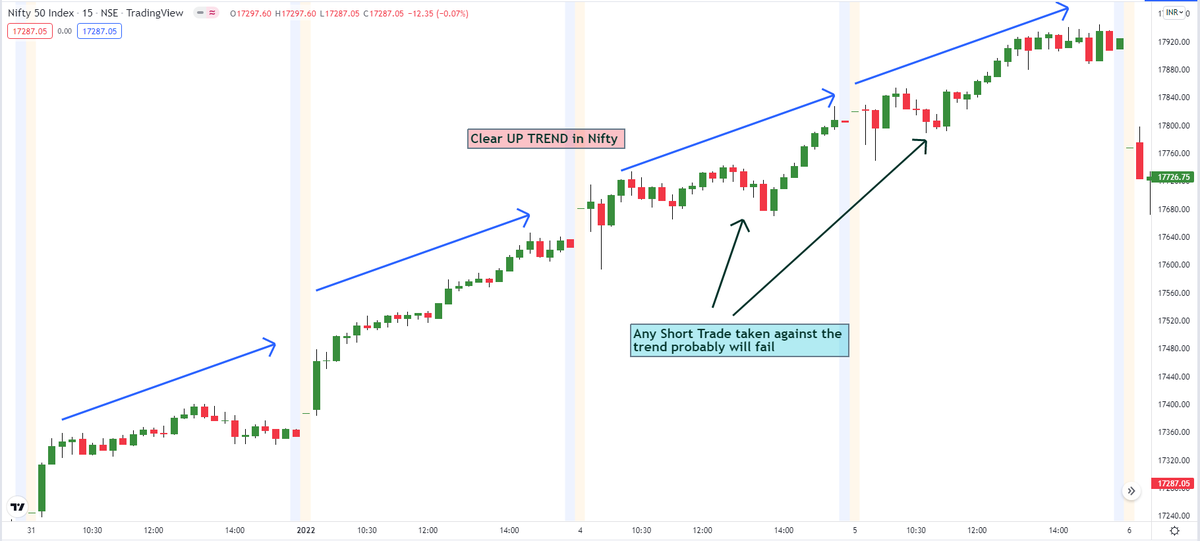
Importance of Trend
"Trend is our Friend except at the end when it bends"
Trend Following importance explained in 4 charts -
Going against the trend stands very less chance of success as explained in this chart that cover 5 days of uptrend -
3/10
"Trend is our Friend except at the end when it bends"
Trend Following importance explained in 4 charts -
Going against the trend stands very less chance of success as explained in this chart that cover 5 days of uptrend -
3/10
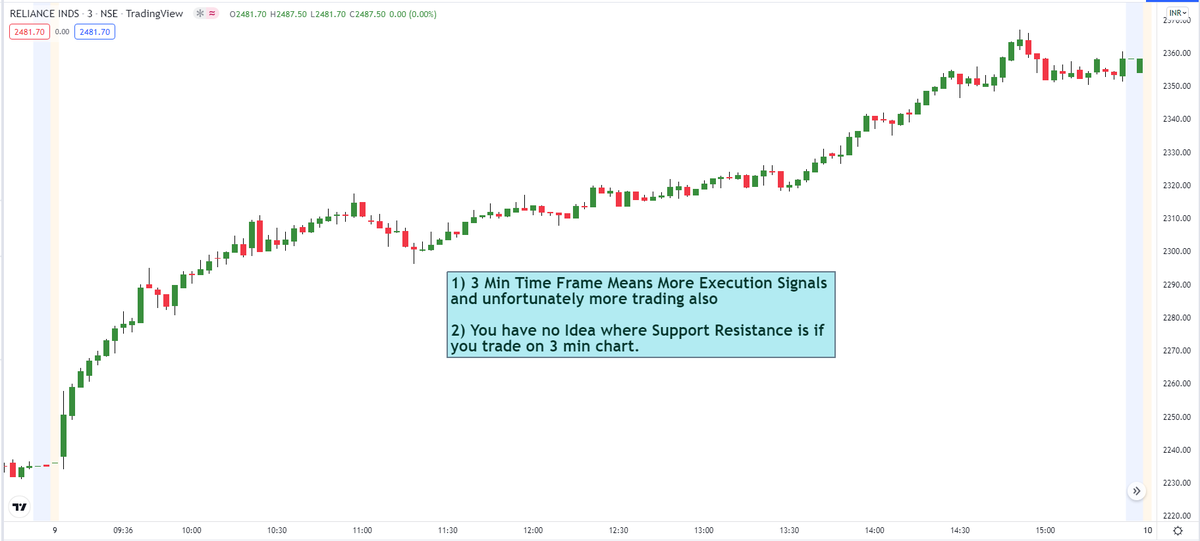
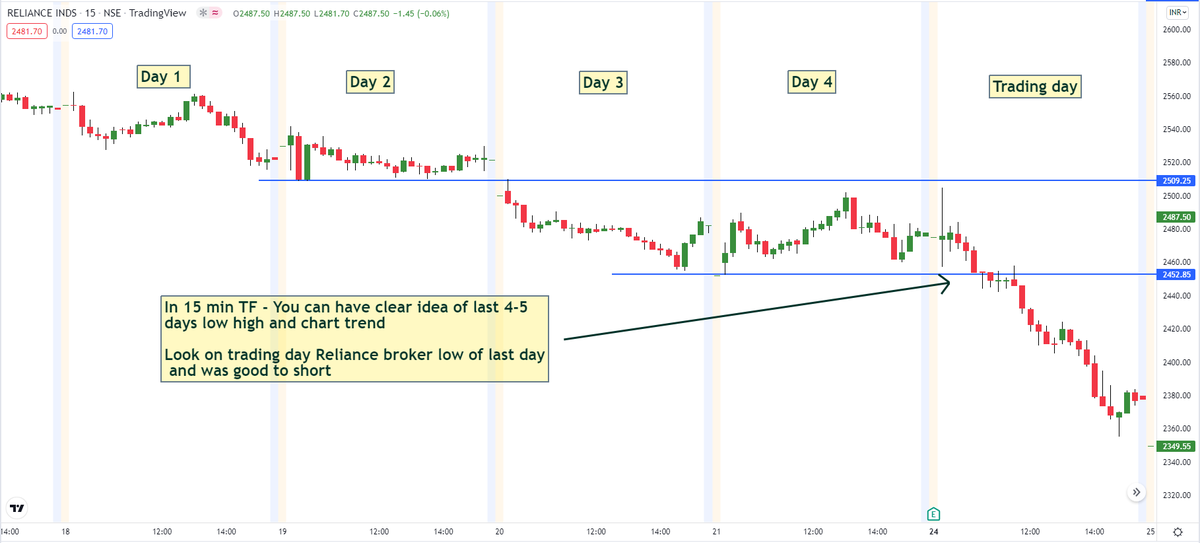
Time Frame importance -
1) 3 min - For Execution
( indicators provide early signals and less reliable)
2) 15 min - to look at trend of week, Support and Resistance of last 4-5 days
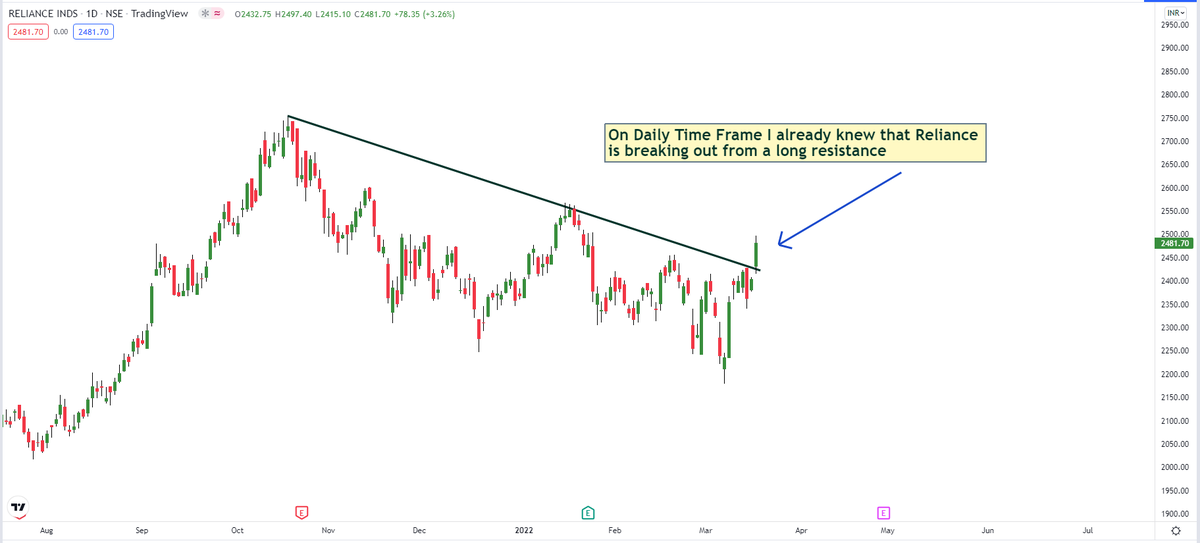
3) Daily - to check current trend and Short Term S-R (More reliability)
Charts -
4/10
1) 3 min - For Execution
( indicators provide early signals and less reliable)
2) 15 min - to look at trend of week, Support and Resistance of last 4-5 days
3) Daily - to check current trend and Short Term S-R (More reliability)
Charts -
4/10
Bullish Day Trading Signals
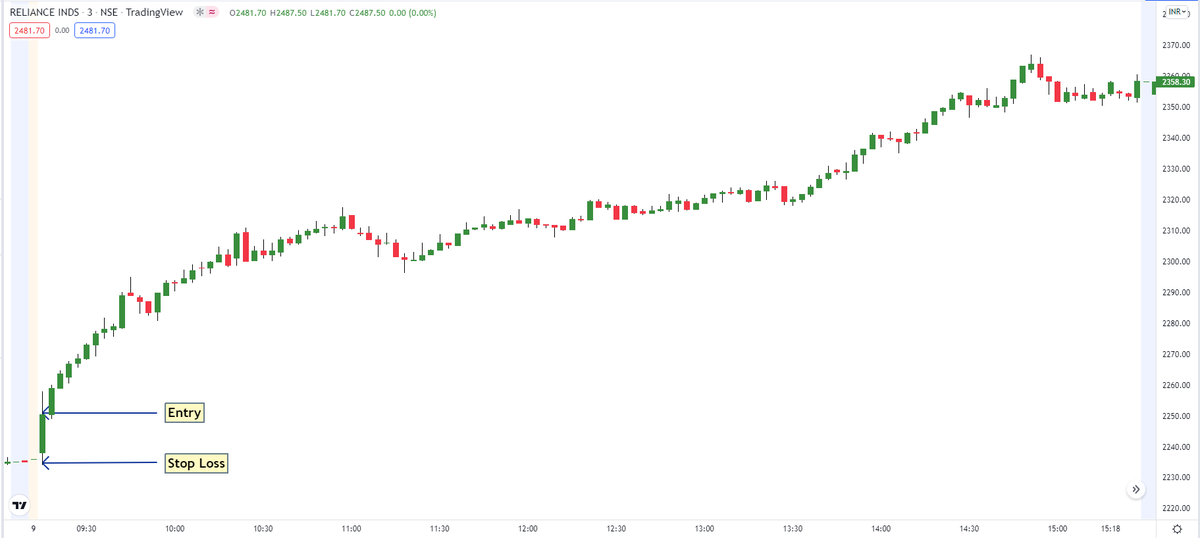
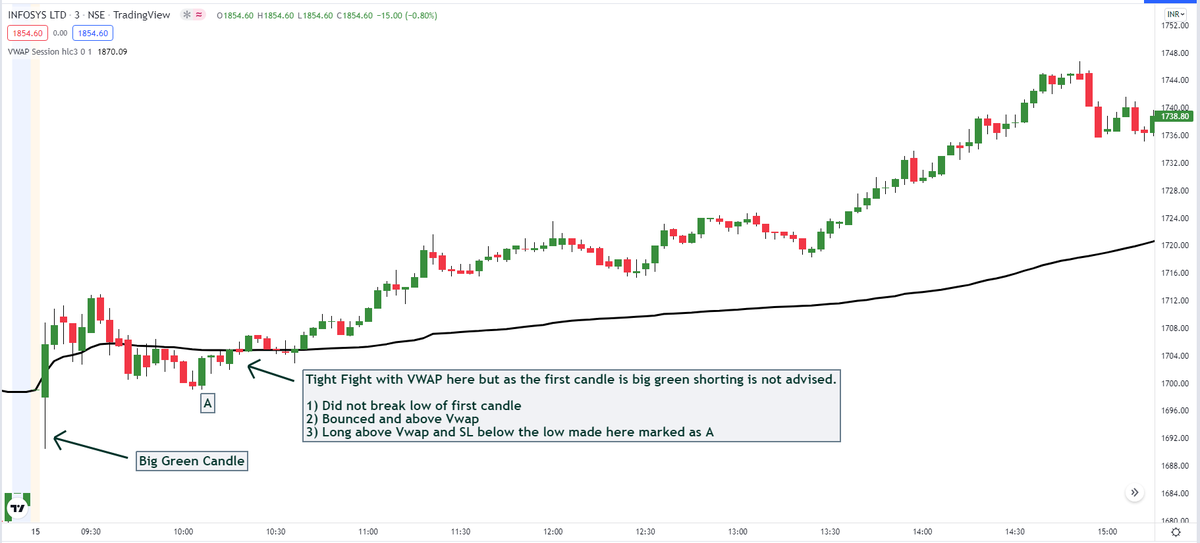
1) First Big Green Candle
First candle is always a good signal and trend setter for the day. Trading in direction of that candle have more success chances
E.g Reliance Big candle on 9 March, Entry with SL below first candle
Success Rate > 60%
5/10
1) First Big Green Candle
First candle is always a good signal and trend setter for the day. Trading in direction of that candle have more success chances
E.g Reliance Big candle on 9 March, Entry with SL below first candle
Success Rate > 60%
5/10
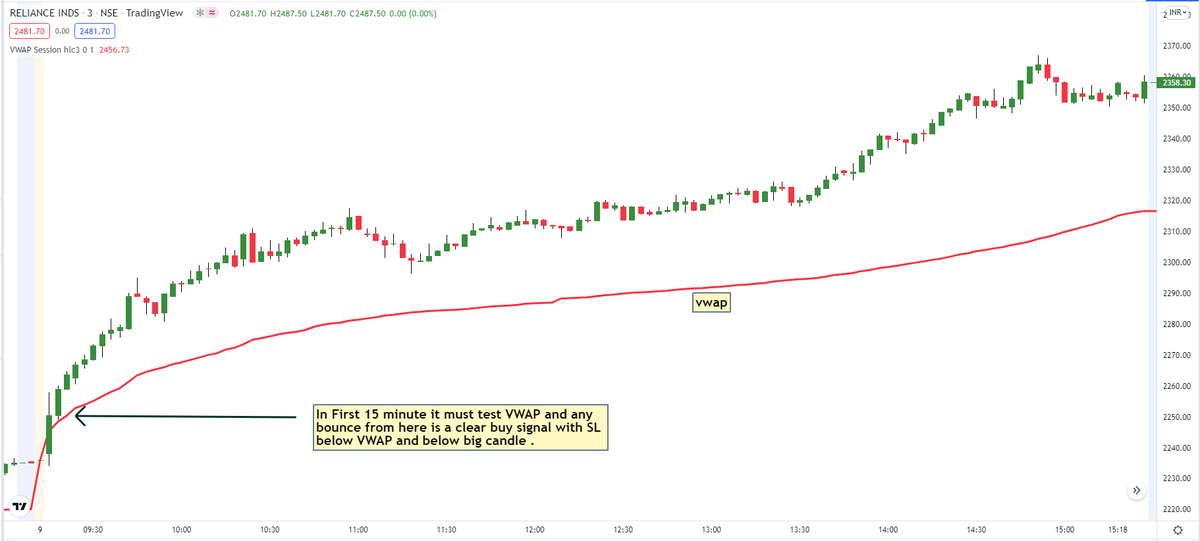
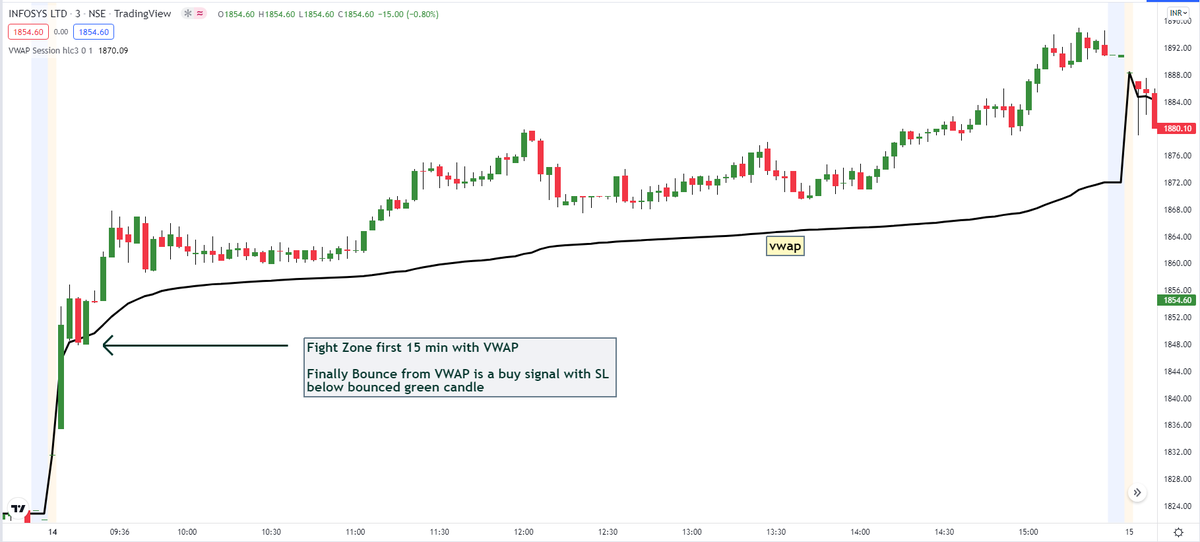
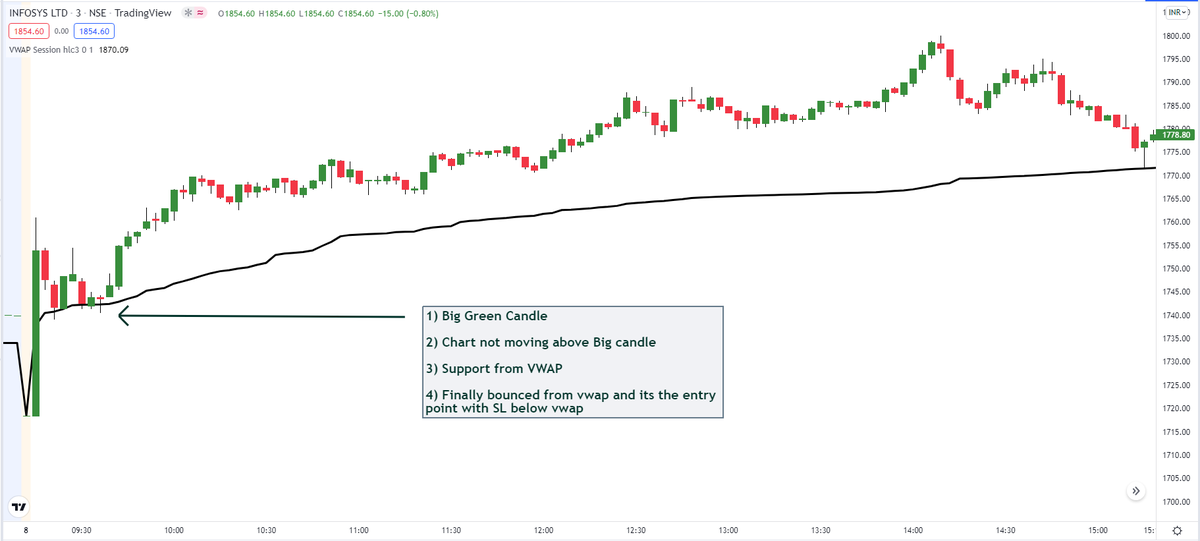
2) VWAP Reaction -
For first 15 min best indicator is VWAP -
1) Chart Reaction with VWAP on a bullish day is explained in 4 charts here -
6/10
For first 15 min best indicator is VWAP -
1) Chart Reaction with VWAP on a bullish day is explained in 4 charts here -
6/10
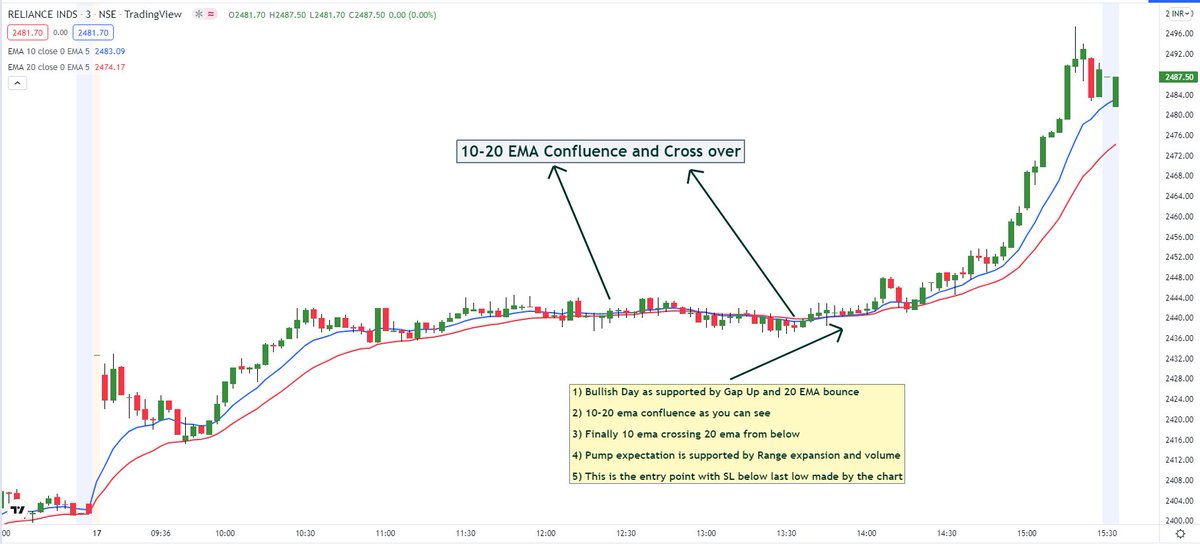
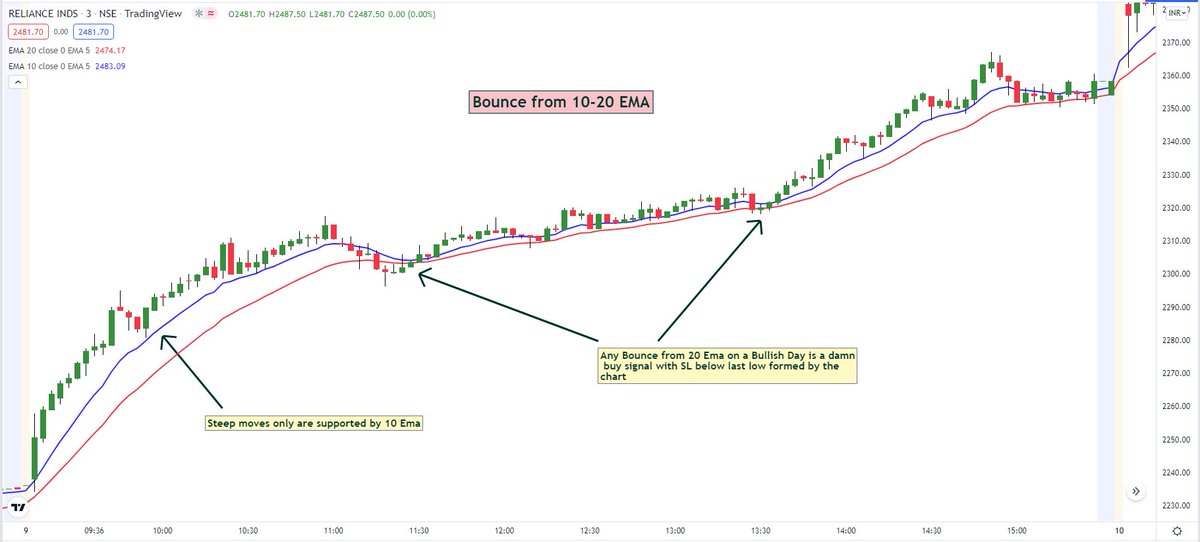
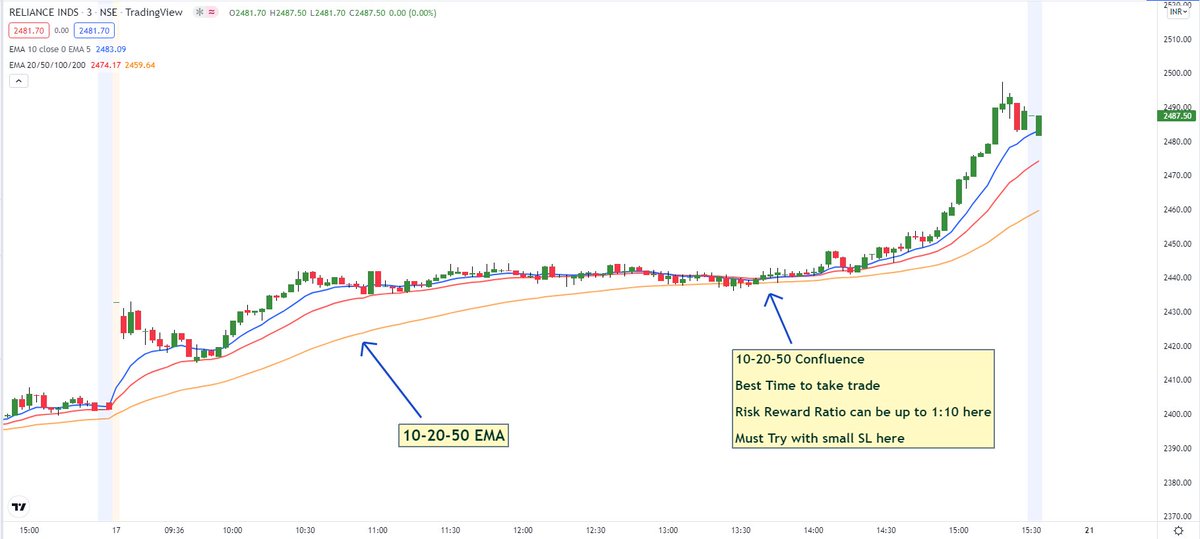
3) 10-20-50 EMA Reaction -
Only on steep up moves, charts get support by 10 ema and do not break that. like 8-10% pump
Bounce from 20 Ema support is a good entry point with SL below low of last 2-3 candles
EMA Confluence and Crossover Entry
Explained with 3 charts -
7/10
Only on steep up moves, charts get support by 10 ema and do not break that. like 8-10% pump
Bounce from 20 Ema support is a good entry point with SL below low of last 2-3 candles
EMA Confluence and Crossover Entry
Explained with 3 charts -
7/10
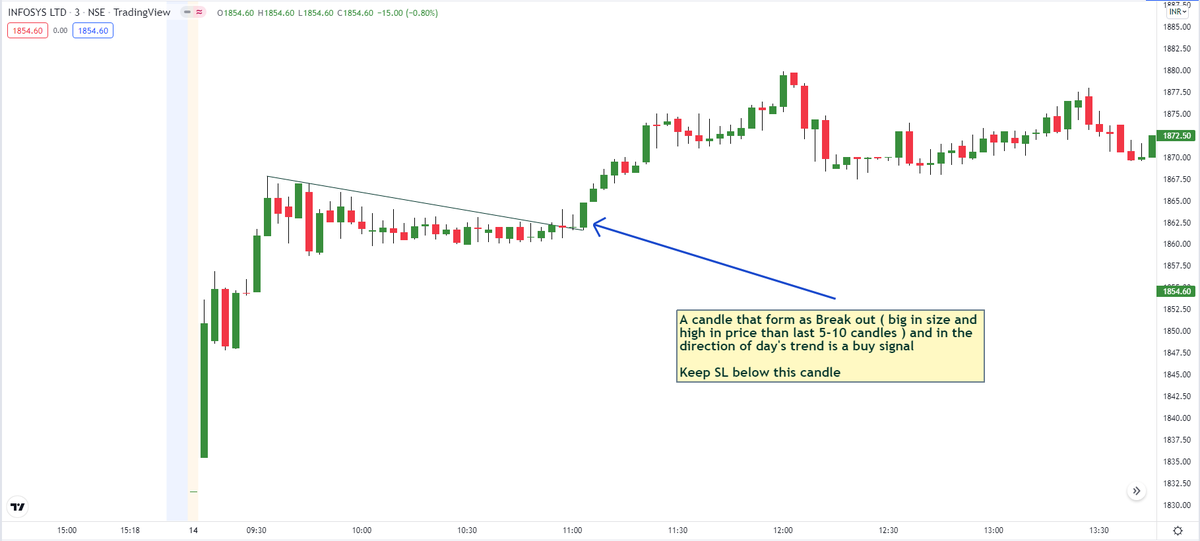
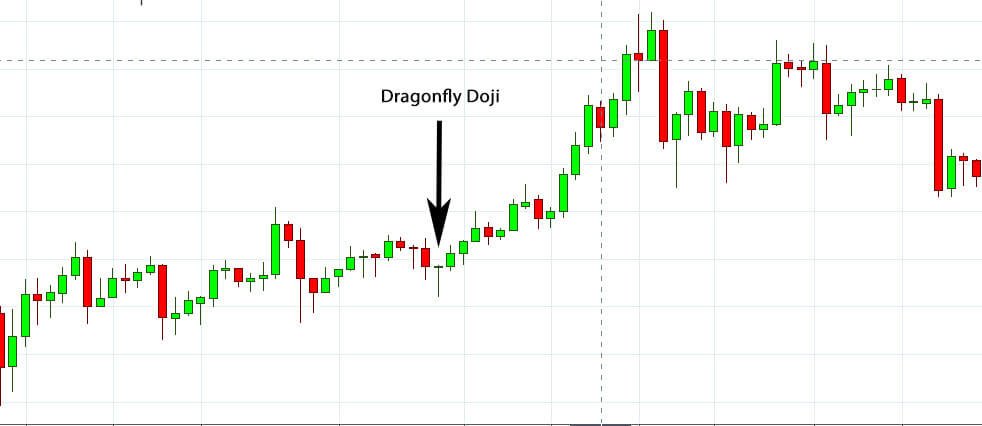
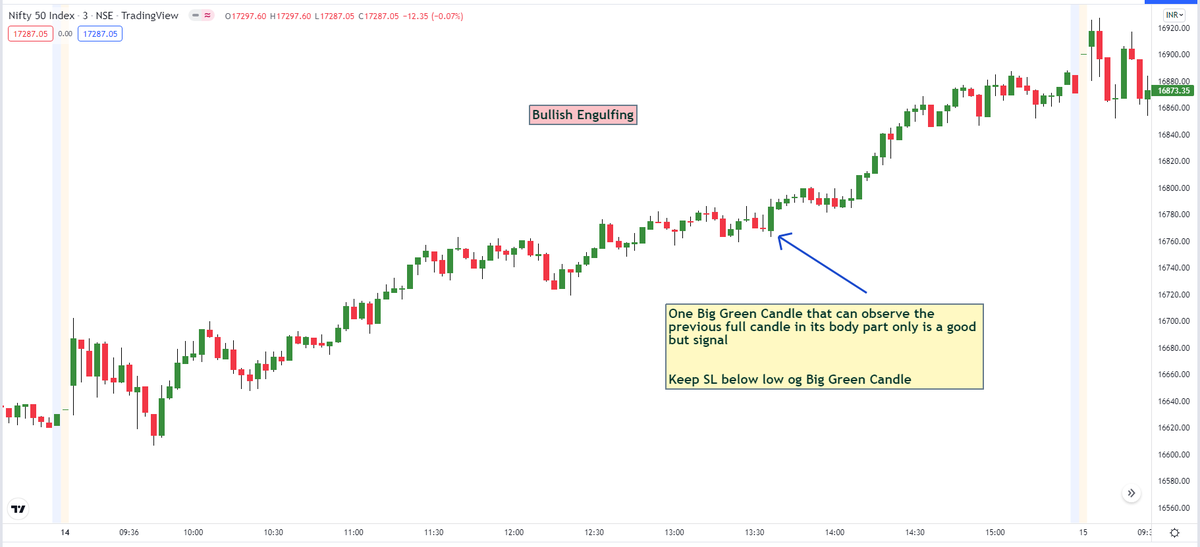
Candles - ( Useful on Bullish Day )
1) Breakout Candle
2) Dragon Fly Doji on consolidation - Enter in next candle once the price is above the high of Doji and keep SL below low of Doji
3) Bullish Engulfing
Explained in 3 charts -
8/10
1) Breakout Candle
2) Dragon Fly Doji on consolidation - Enter in next candle once the price is above the high of Doji and keep SL below low of Doji
3) Bullish Engulfing
Explained in 3 charts -
8/10
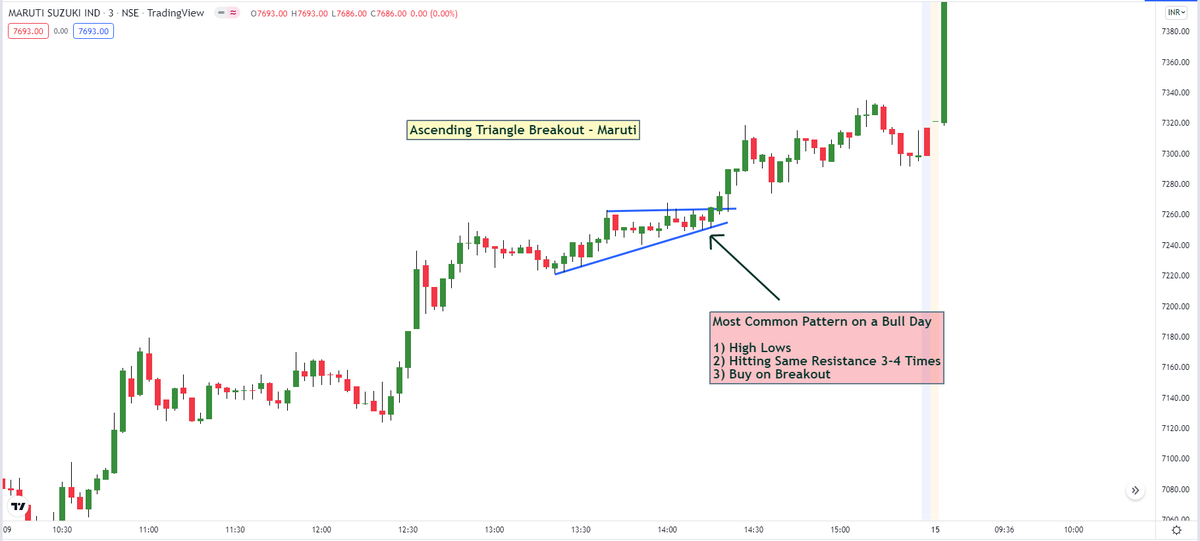
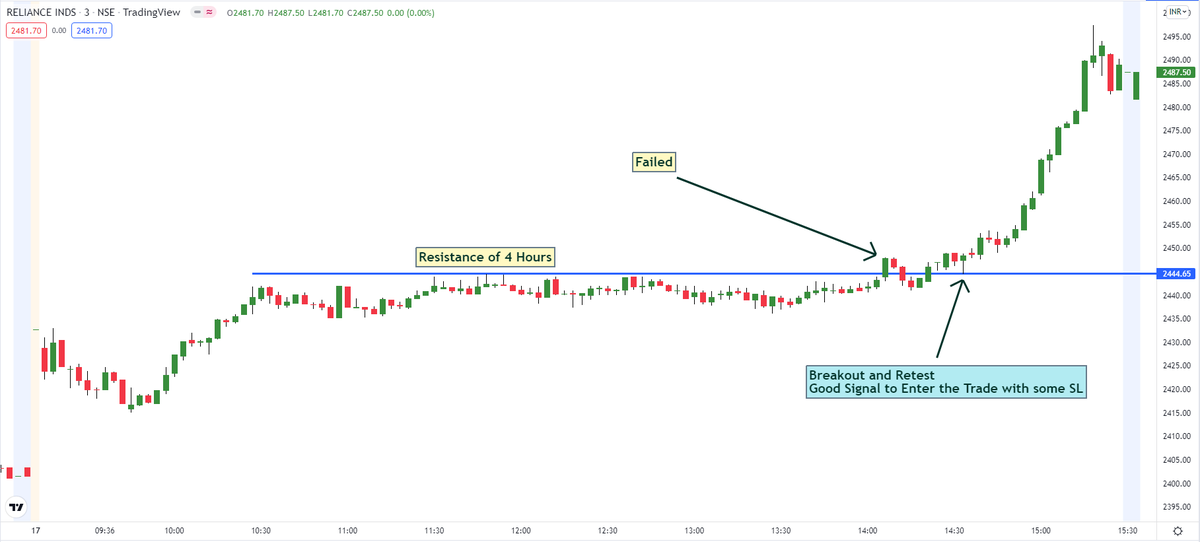
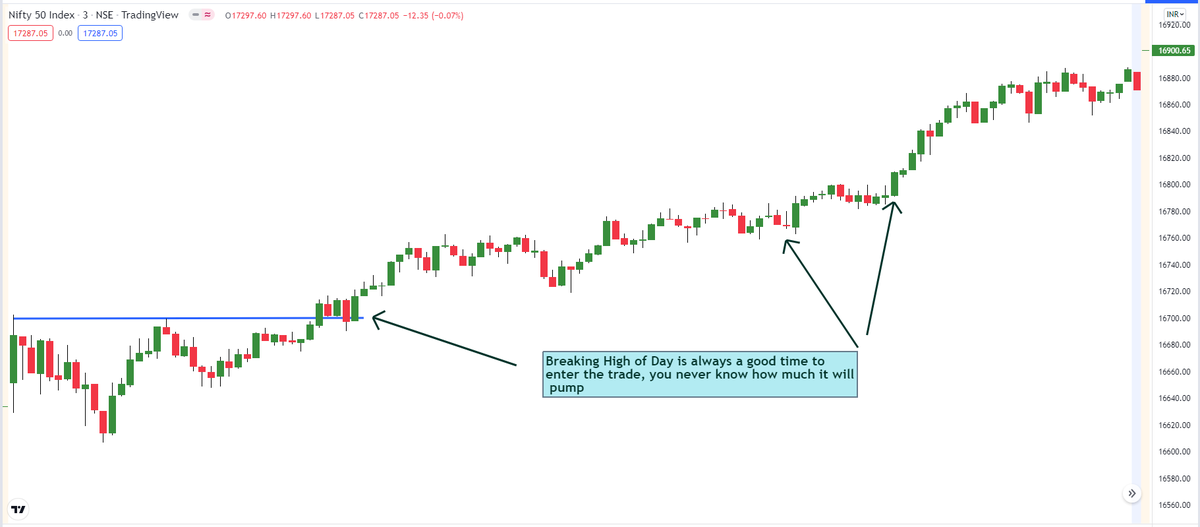
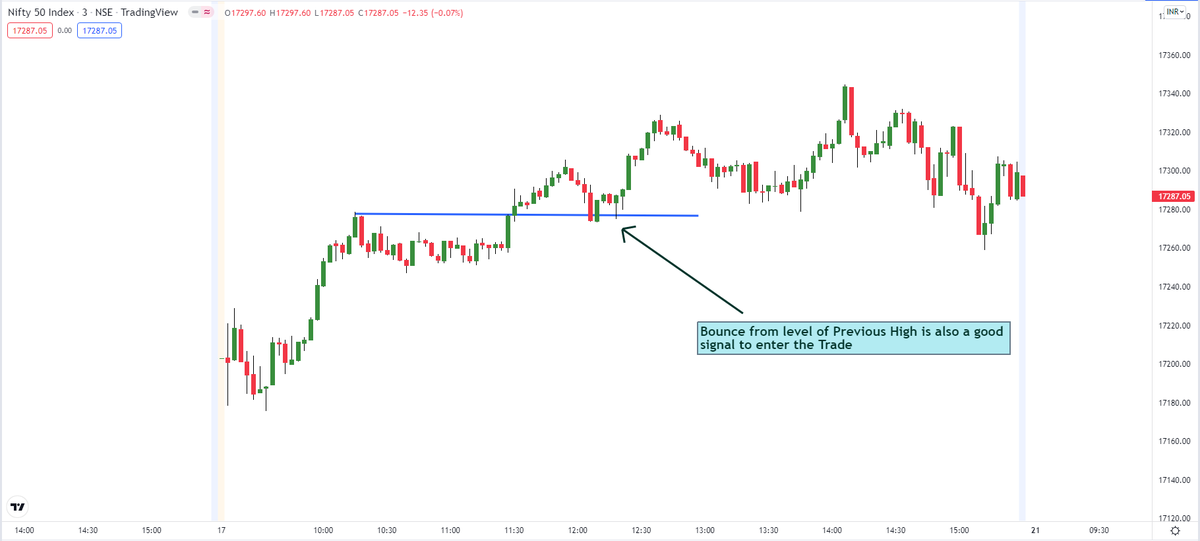
Pattern/Signals on Bullish Day -
1) Ascending Triangle Breakout - Most Common
2) Resistance Breakout
3) New High of Day
4) Bounce from last high of Same Day
Explained in Charts -
9/10
1) Ascending Triangle Breakout - Most Common
2) Resistance Breakout
3) New High of Day
4) Bounce from last high of Same Day
Explained in Charts -
9/10
Some Important Points -
1) Never Trade against the Big Candles
2) Never trade against the trend
3) Never trade without SL
4) Don't move SL accept it
5) 1:2 Risk Reward is minimum to take trade
6) 50% Win Rate is excellent
7) Try to make profit according to capital Only
10/10
1) Never Trade against the Big Candles
2) Never trade against the trend
3) Never trade without SL
4) Don't move SL accept it
5) 1:2 Risk Reward is minimum to take trade
6) 50% Win Rate is excellent
7) Try to make profit according to capital Only
10/10
Loading suggestions...