

the process:
1⃣ wait for the first hour bar to close (10am)
2⃣ wait for the second hour bar to become a 2 (break of high/low of the previous bar)
3⃣ wait for the price to come back in the middle point area of the previous hourly bar
4⃣ find a trigger pattern on 5min chart
1⃣ wait for the first hour bar to close (10am)
2⃣ wait for the second hour bar to become a 2 (break of high/low of the previous bar)
3⃣ wait for the price to come back in the middle point area of the previous hourly bar
4⃣ find a trigger pattern on 5min chart
Here following some examples from the last 3 weeks in #spy:
✅6 sessions with a triggered entry
✅5 sessions without entry point 👇
✅6 sessions with a triggered entry
✅5 sessions without entry point 👇
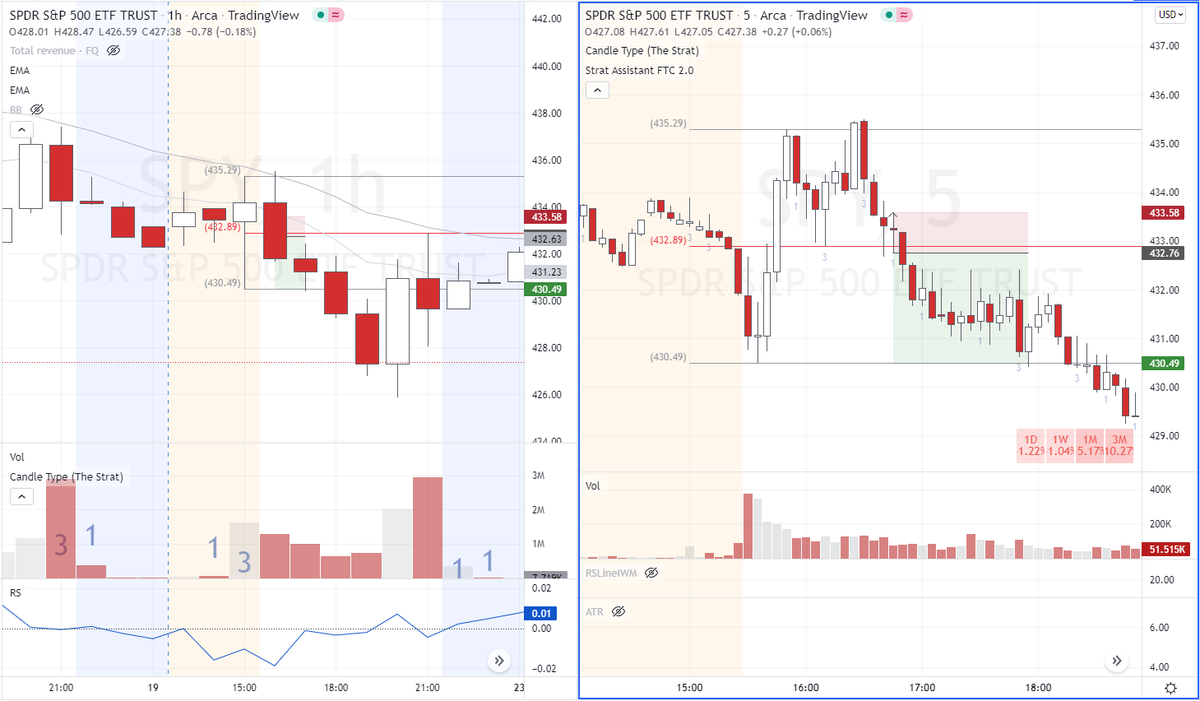
1.
✅ 22 Feb session
✅ price broke high (435.29) and come back to middle point area (432.89)
✅ trigger setup: 1-2d on 5min chart
✅ R realized: 2.8
✅ 22 Feb session
✅ price broke high (435.29) and come back to middle point area (432.89)
✅ trigger setup: 1-2d on 5min chart
✅ R realized: 2.8
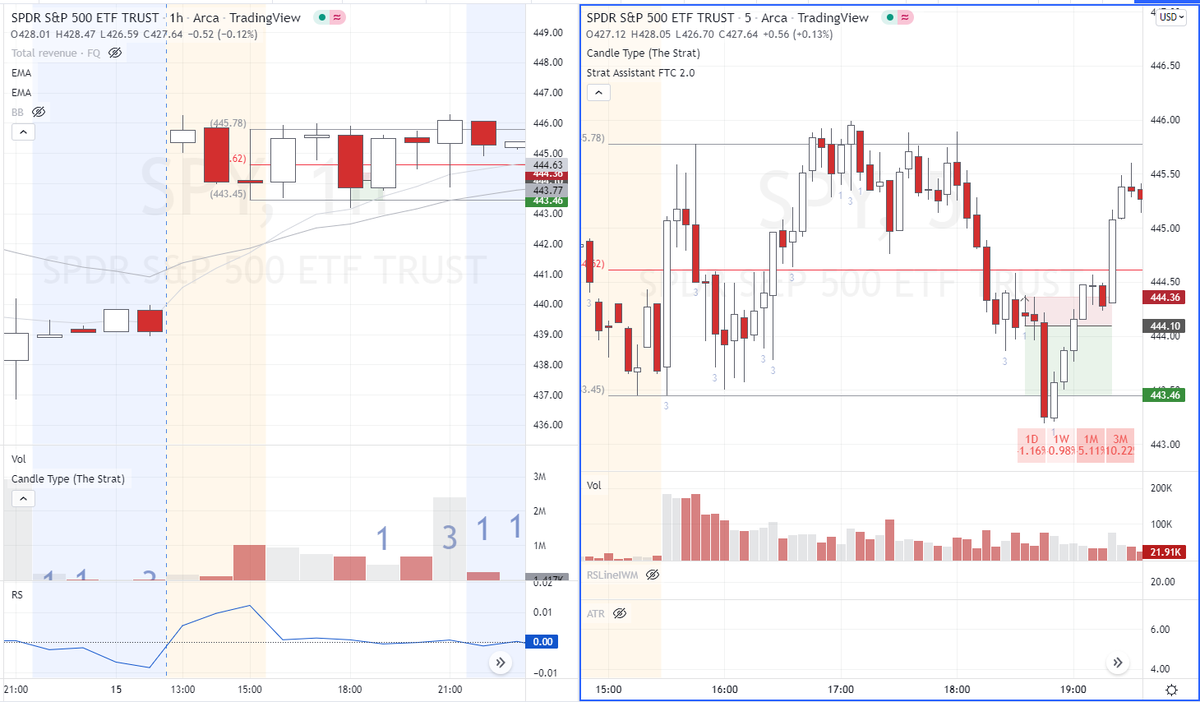
2.
✅ 15 Feb session
✅ price broke high (445.78) and come back to middle point area (444.62)
✅ trigger setup: 1-2d
✅ R realized: 2.4
✅ 15 Feb session
✅ price broke high (445.78) and come back to middle point area (444.62)
✅ trigger setup: 1-2d
✅ R realized: 2.4
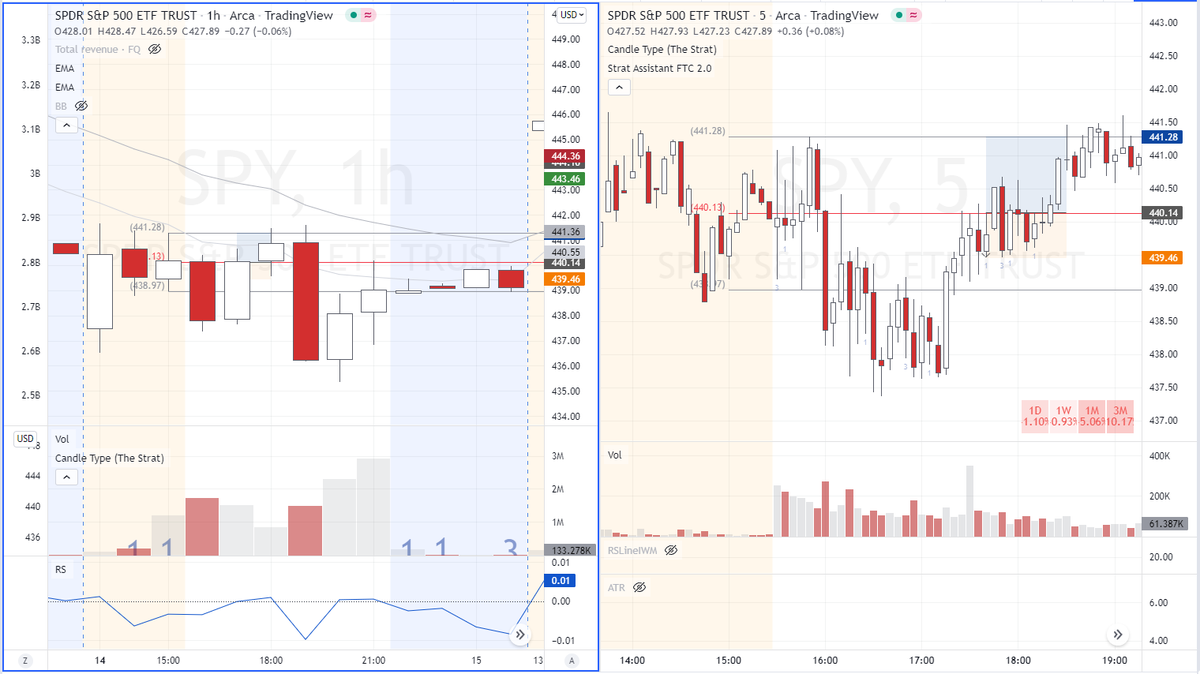
3.
✅ 14 Feb session
✅ price broke low (438.97) and come back to middle point area (440.13)
✅ trigger setup: 1-2u
✅ R realized: 1.7
✅ 14 Feb session
✅ price broke low (438.97) and come back to middle point area (440.13)
✅ trigger setup: 1-2u
✅ R realized: 1.7
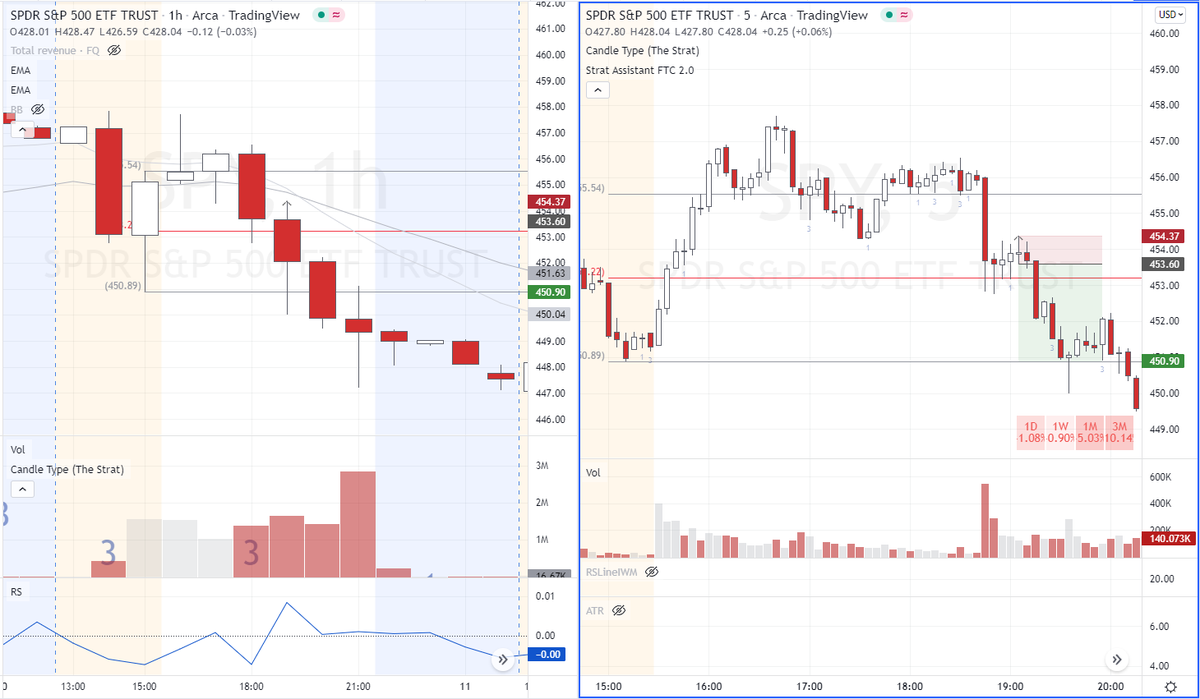
4.
✅ 10 Feb session
✅ price broke high (455.54) and come back to middle point area (453.22)
✅ trigger setup: 2u-2d
✅ R realized: 3.5
✅ 10 Feb session
✅ price broke high (455.54) and come back to middle point area (453.22)
✅ trigger setup: 2u-2d
✅ R realized: 3.5
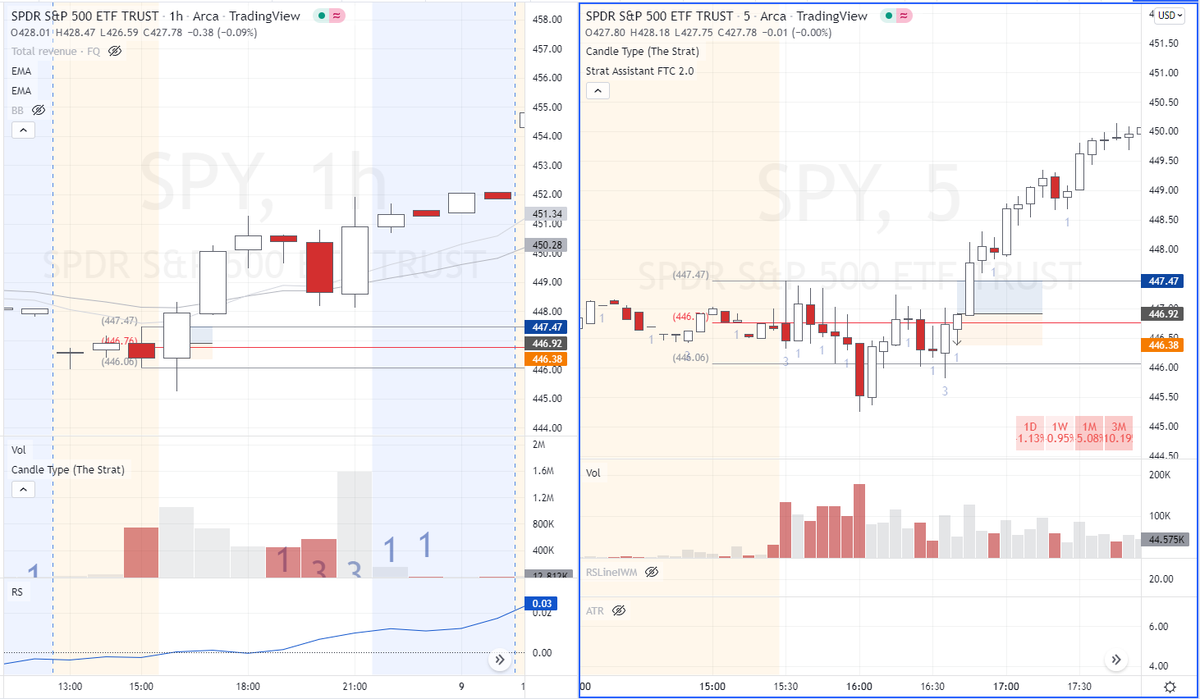
5.
✅ 8 Feb session
✅ price broke low (446.06) and come back to middle point area (446.75)
✅ trigger setup: 1-2u
✅ R realized: 1
✅ 8 Feb session
✅ price broke low (446.06) and come back to middle point area (446.75)
✅ trigger setup: 1-2u
✅ R realized: 1
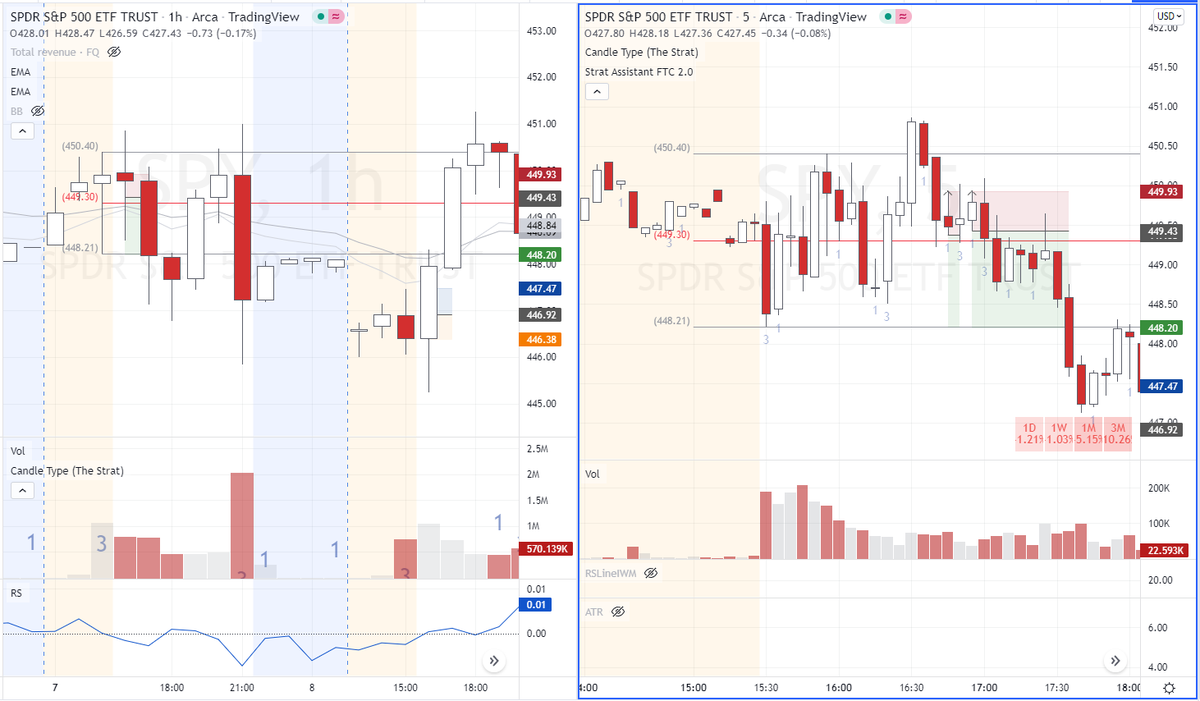
6.
✅ 7 Feb session
✅ price broke high (450.40) and come back to middle point area (449.30)
✅ trigger setup: first entry 1-3d, second entry 1-3d
✅ R realized: 1.50 (-1 + 2.5)
✅ 7 Feb session
✅ price broke high (450.40) and come back to middle point area (449.30)
✅ trigger setup: first entry 1-3d, second entry 1-3d
✅ R realized: 1.50 (-1 + 2.5)
In summary:
.sessions triggered: 6/11
.long trades: 2
.short trades: 4
.total trades: 7
.trades at target: 6
.loss: 1
.total R: 10... not bad!
.sessions triggered: 6/11
.long trades: 2
.short trades: 4
.total trades: 7
.trades at target: 6
.loss: 1
.total R: 10... not bad!
If you like this content, please share the very first tweet and make sure to follow @tradingandata for new data and insights.
By the way, for more content about strategies, backtesting and wisdom from the #trading Masters, check this growing library 👇
By the way, for more content about strategies, backtesting and wisdom from the #trading Masters, check this growing library 👇
Loading suggestions...