

My Multi timeframe analysis for Bitcoin.
It is discount time, so soon is time for shopping!💰
📝Take a look at a process top down analysis from 12h chart to 3 min chart.👇👇
It is discount time, so soon is time for shopping!💰
📝Take a look at a process top down analysis from 12h chart to 3 min chart.👇👇
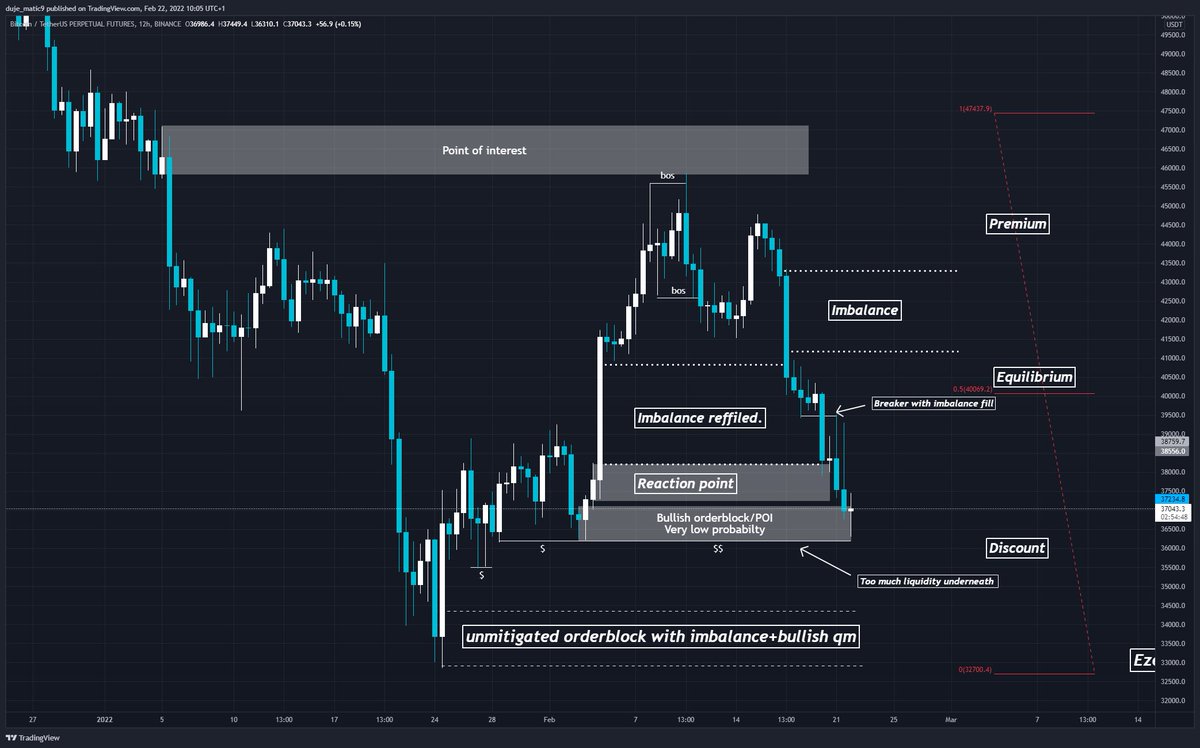
So on the 12h chart we can see that the price comes from the re-entry of institutions.
But if you take a closer look, you’ll see how much liquidity they left before real shopping.
But if you take a closer look, you’ll see how much liquidity they left before real shopping.
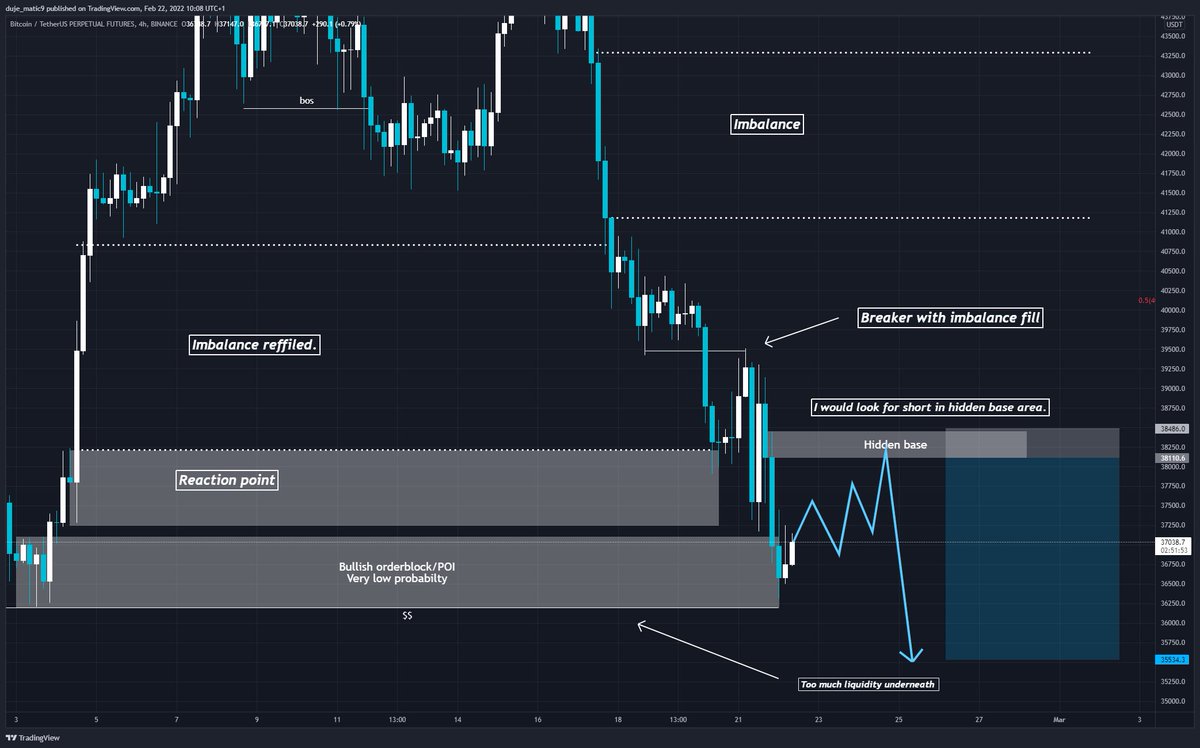
On 4h chart we can see the hidden base. This is a hidden zone where a good re entry for short can be expected.
The market is fractal and moves in movements (lower high-lower low).
This is the zone in which you would watch the price movement for a re-entry short position.
The market is fractal and moves in movements (lower high-lower low).
This is the zone in which you would watch the price movement for a re-entry short position.
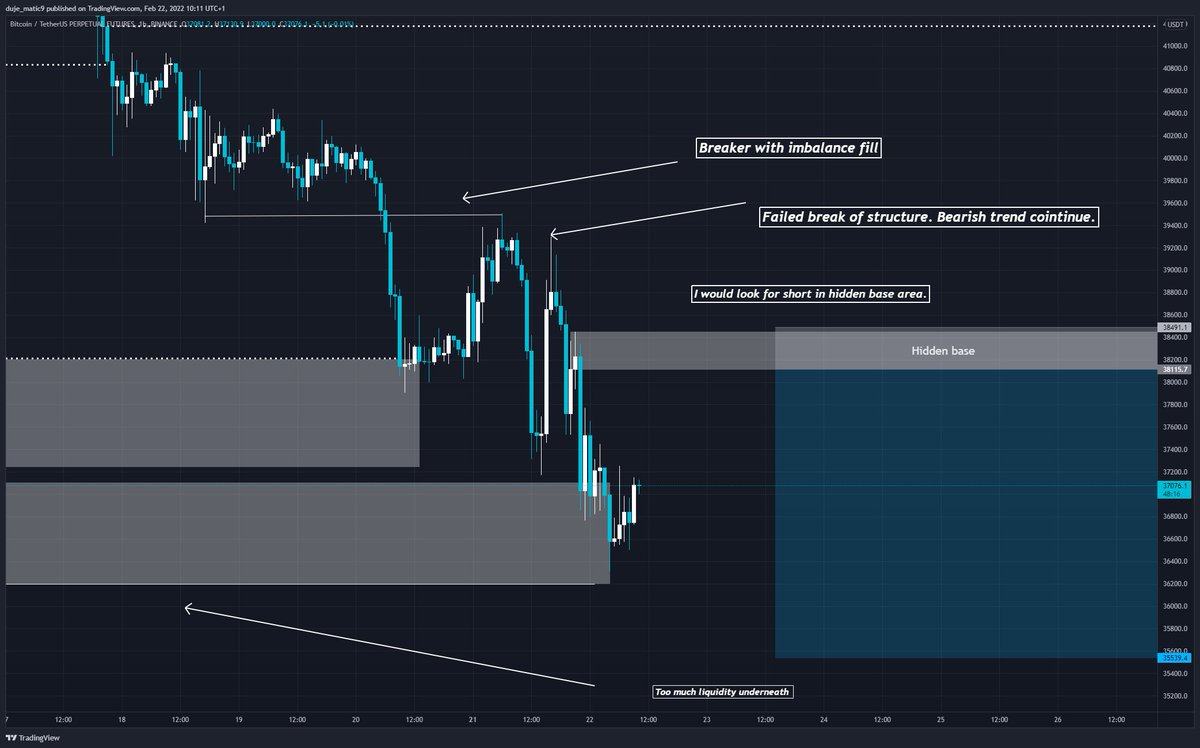
On the 1h chart we can see cleaner price action.
Hidden base makes more and more sense.🎯
Hidden base makes more and more sense.🎯
We enter the Lower timeframe area.
We can get lost there quickly if we don't keep the bias with the Higher timeframe.
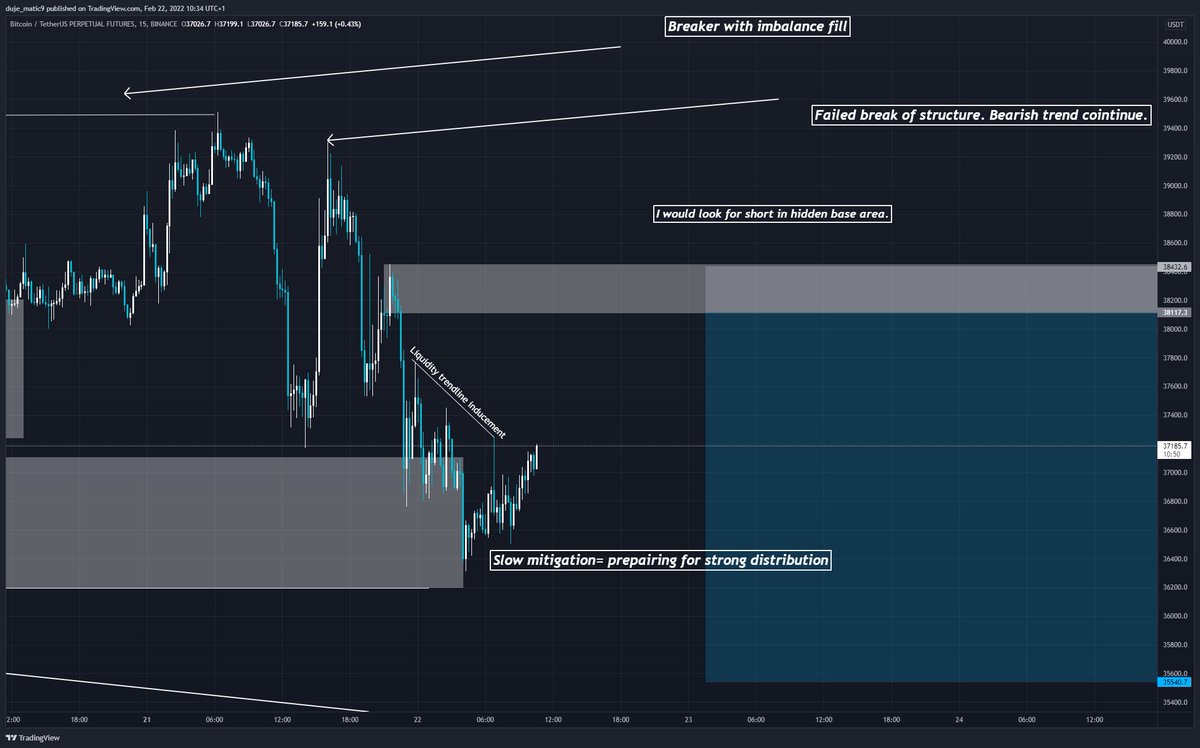
On the 15 min chart we see a gradual mitigation.
📝After each slow mitigation there is a rapid movement.
We can get lost there quickly if we don't keep the bias with the Higher timeframe.
On the 15 min chart we see a gradual mitigation.
📝After each slow mitigation there is a rapid movement.
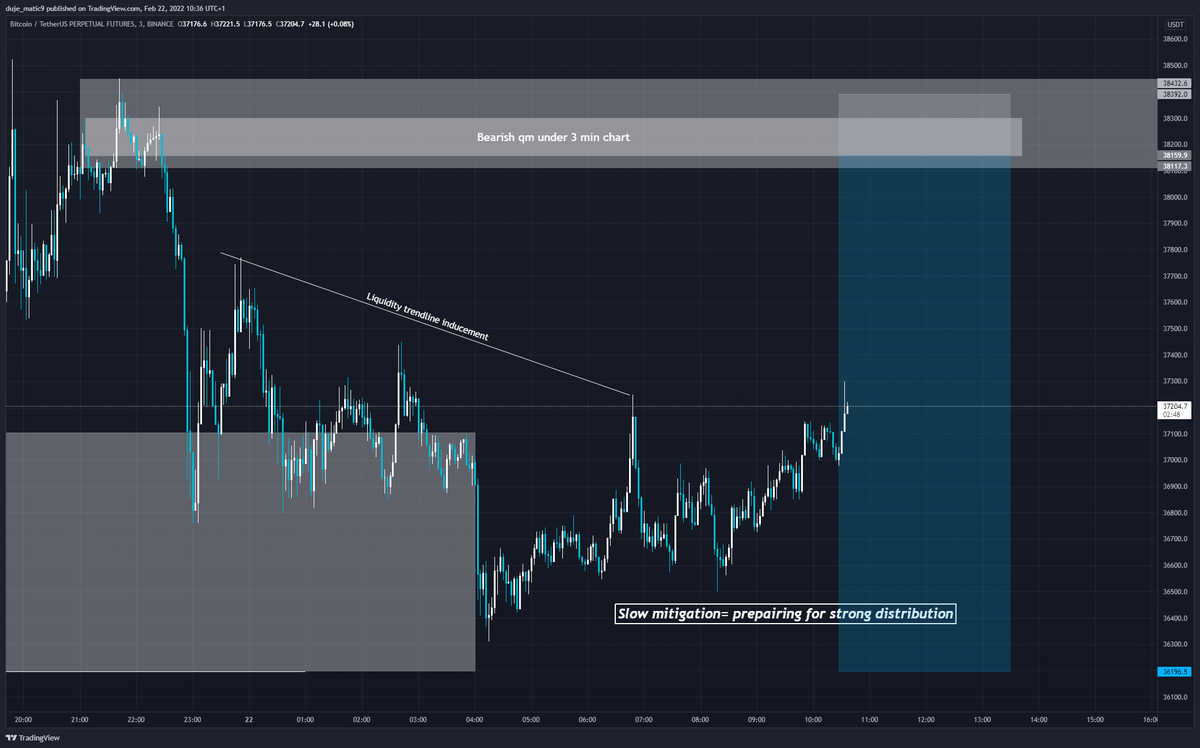
On the 3 min chart I watch the entrance. This is where we need to be focused and concentrated.
In my hidden base I see a bearish qm that I could / should follow.
Never enter a trade randomly.
🪙🪙🪙
In my hidden base I see a bearish qm that I could / should follow.
Never enter a trade randomly.
🪙🪙🪙
Loading suggestions...