

1) Theory
Please read the following text paragraphs to understand the theory and idea behind EMAs if you don't know it yet.
If you already feel comfortable with your knowledge on #EMAs you can just skip to chapter 2.
Please read the following text paragraphs to understand the theory and idea behind EMAs if you don't know it yet.
If you already feel comfortable with your knowledge on #EMAs you can just skip to chapter 2.
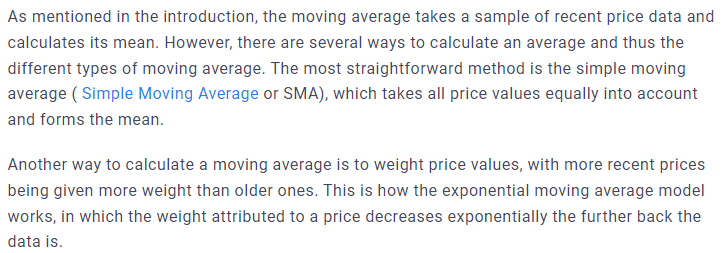
What is an Exponential Moving Average (=EMA)?
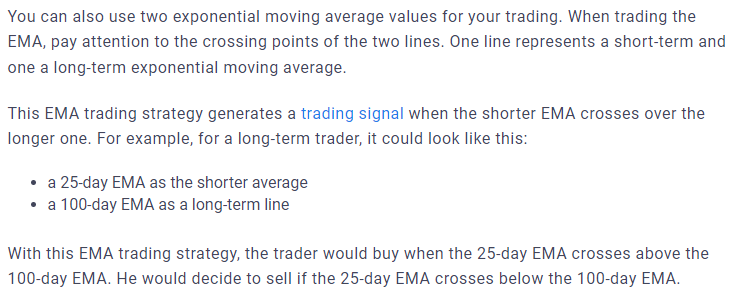
The EMA Trading Strategy
Which EMA to use?
This is pretty much very subjective and depends on your exact strategy.
I like to use the 200 EMA as the long-term EMA and the 21 & 55 EMA as short-term EMAs.
This is pretty much very subjective and depends on your exact strategy.
I like to use the 200 EMA as the long-term EMA and the 21 & 55 EMA as short-term EMAs.
Why 21 and 55 EMAs?
20 & 50 EMAs are pretty popular and everyone is looking at them. If everyone is always looking at the same indicator there's a chance that it might print false signals from time to time. So I chose two Fibonacci numbers that are very close to 20 & 50 (21/55)
20 & 50 EMAs are pretty popular and everyone is looking at them. If everyone is always looking at the same indicator there's a chance that it might print false signals from time to time. So I chose two Fibonacci numbers that are very close to 20 & 50 (21/55)
2) 21/200 EMA Crossover
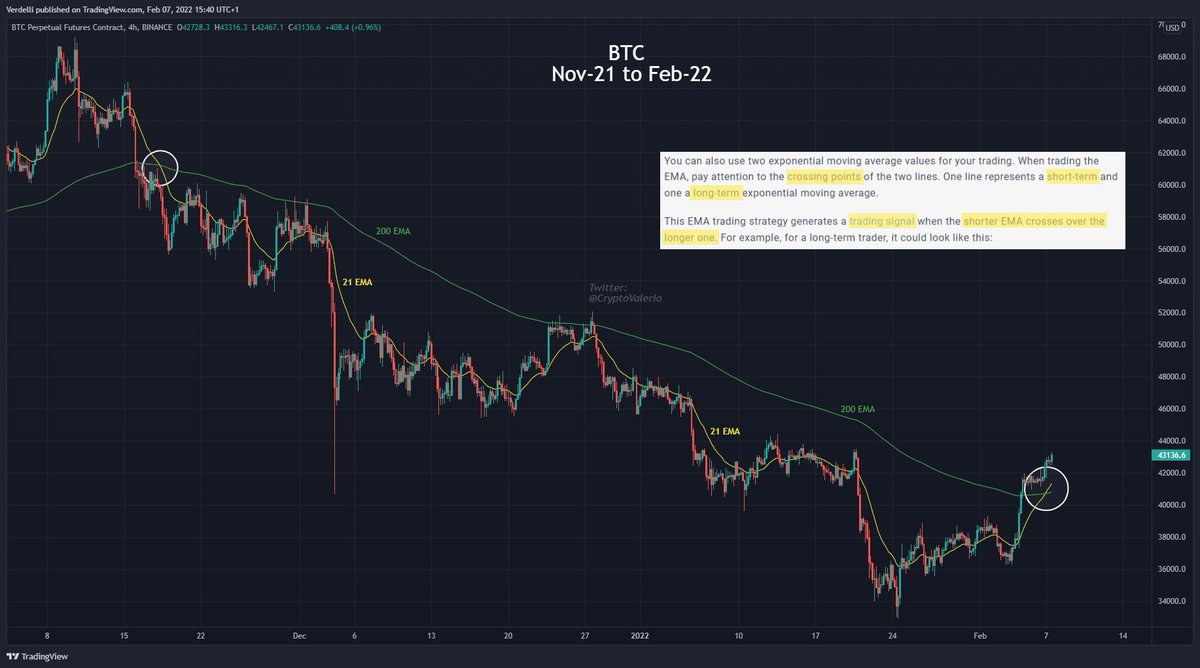
The 21 EMA crossed below the 200 EMA on Nov 18th 2021 which confirmed the beginning of this 3-month long correction.
And now for the very first time in this correction, the 21 EMA just crossed back above the 200 EMA which is a bullish trading signal.
The 21 EMA crossed below the 200 EMA on Nov 18th 2021 which confirmed the beginning of this 3-month long correction.
And now for the very first time in this correction, the 21 EMA just crossed back above the 200 EMA which is a bullish trading signal.
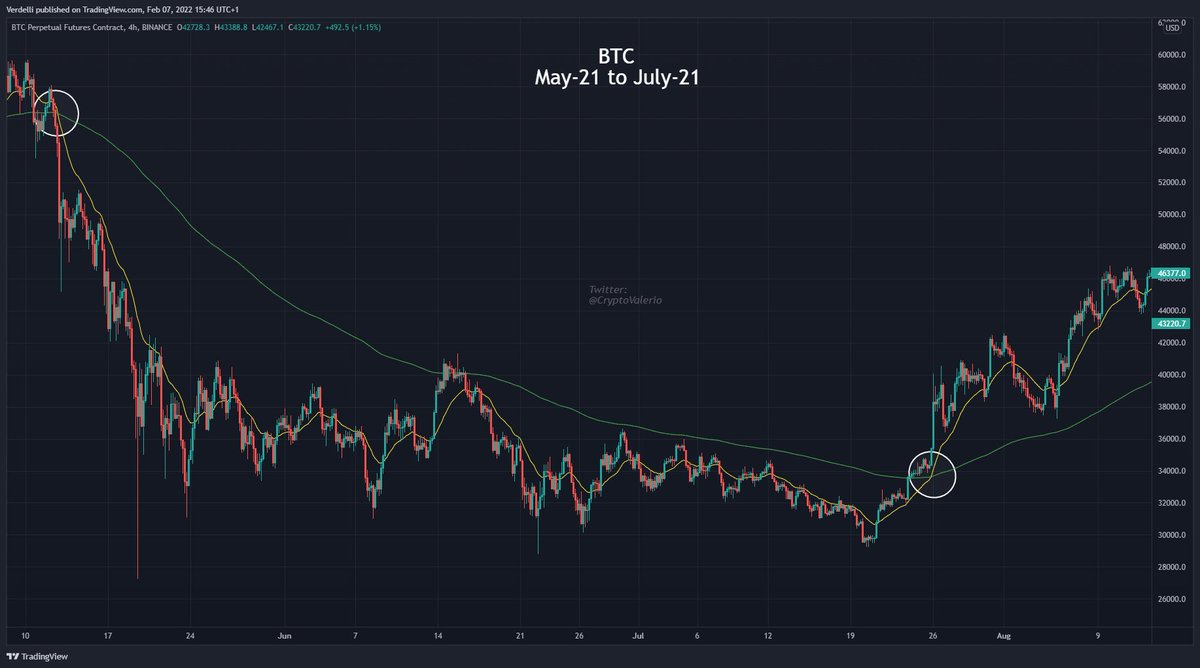
This EMA crossover also confirmed the breakout during the summer low of 2021.
Sometimes it also prints false signals. For example during the Sep/Oct 2021 correction only the second bullish crossover marked the beginning of an uptrend. The first crossover was only a fakeout because a couple of candles later the 21 EMA crossed back below the 200 EMA again.
3) 55/200 EMA
A more significant indication - that is more consistent and prints fewer false signals - is when the 55 EMA crosses above the 200 EMA.
Let's see how well this indication worked during the past few corrections:
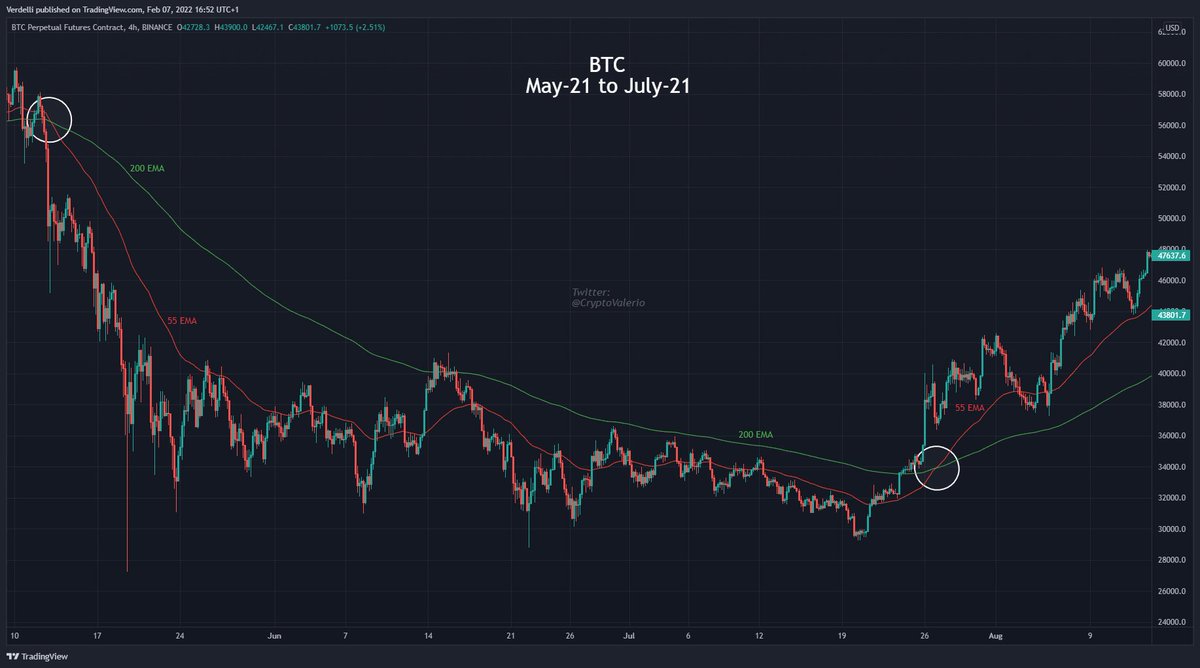
1. Summer 2021
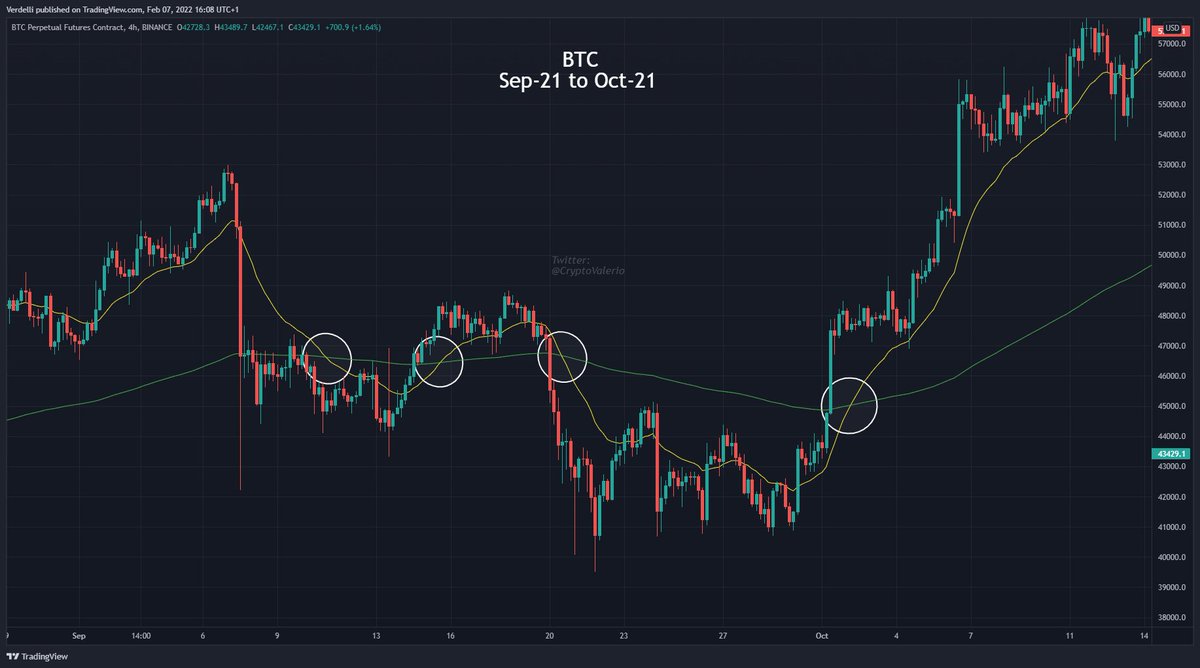
2. Sep-Oct 2021
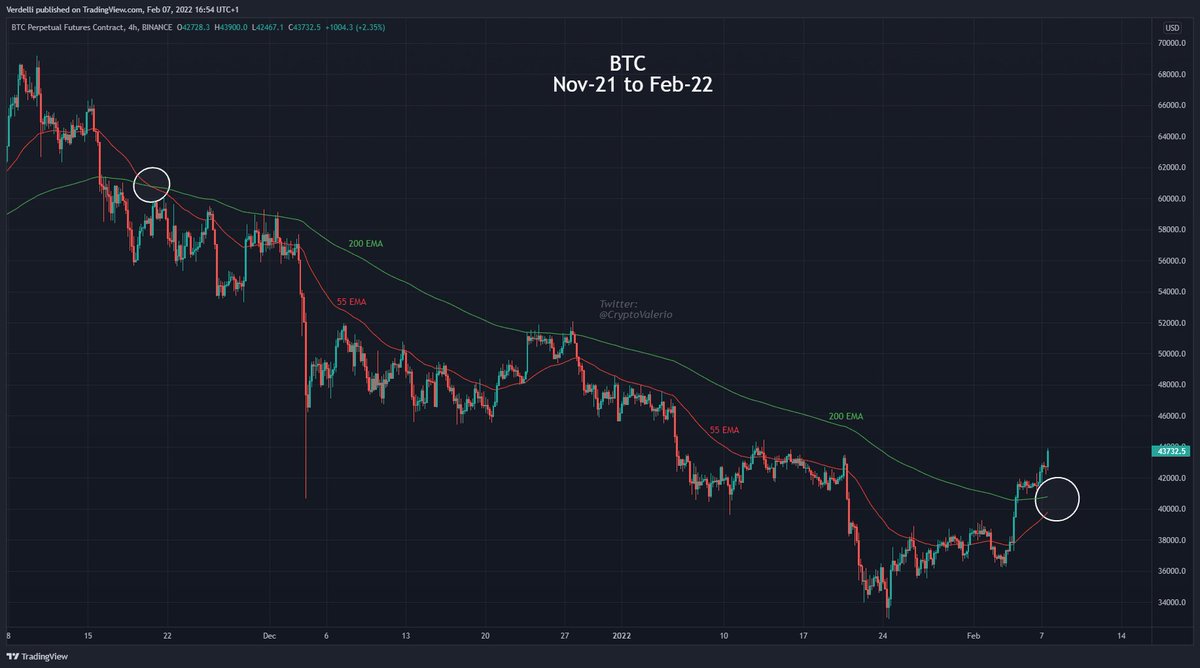
3. Nov 2021 - Feb 2022
A more significant indication - that is more consistent and prints fewer false signals - is when the 55 EMA crosses above the 200 EMA.
Let's see how well this indication worked during the past few corrections:
1. Summer 2021
2. Sep-Oct 2021
3. Nov 2021 - Feb 2022
1. Summer 2021:
During the summer correction of last year, this crossover worked pretty well.
During the summer correction of last year, this crossover worked pretty well.
2. Sep/Oct 2021:
Instead of printing a false signal like the 21/200 EMA crossover did for the Oct-21 correction, this crossover (55/200 EMA) only printed a correct signal!
More consistent as you can see!
Instead of printing a false signal like the 21/200 EMA crossover did for the Oct-21 correction, this crossover (55/200 EMA) only printed a correct signal!
More consistent as you can see!

3. Nov-21 to Feb-22:
The 55 EMA crosses below the 200 EMA on Nov 20th 2021 which confirmed the downtrend. The 55 EMA is still below the 200 EMA as of today but we are nearing a potential bullish crossover.
The 55 EMA crosses below the 200 EMA on Nov 20th 2021 which confirmed the downtrend. The 55 EMA is still below the 200 EMA as of today but we are nearing a potential bullish crossover.

There is a high chance that this crossover would then indicate the beginning of an impulsive move to the upside.
I am now sitting on my hands and just patiently waiting for the 55 EMA to cross above the 200 EMA.
Interesting weeks ahead of us for sure!
Like & RT! <3
I am now sitting on my hands and just patiently waiting for the 55 EMA to cross above the 200 EMA.
Interesting weeks ahead of us for sure!
Like & RT! <3
Loading suggestions...