

Top 5 Trend #Indicators that identify the Direction of Trend
A thread(🧵)... (1/22)
A thread(🧵)... (1/22)

1. Moving Average: The Simplest of all indicators that every #trader trusts have to be #MovingAverage.
Based on the type of trade: Swing, Positionalor #Intraday, traders may look at various moving Averages (2/22)
Based on the type of trade: Swing, Positionalor #Intraday, traders may look at various moving Averages (2/22)
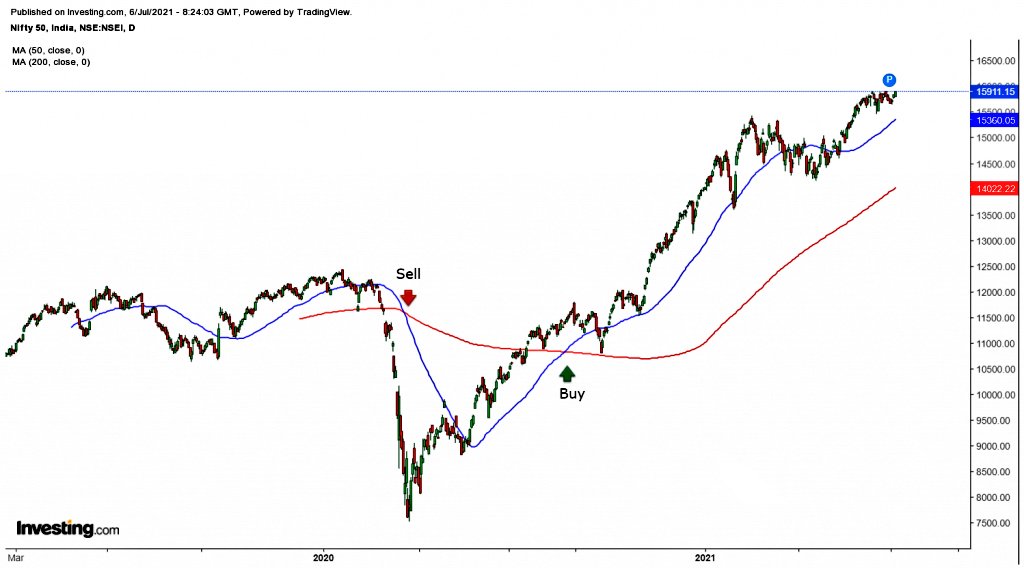
If the Moving Average is horizontal, the #stock price is ranging. If it is angled up, there is an upward Trend (3/22)
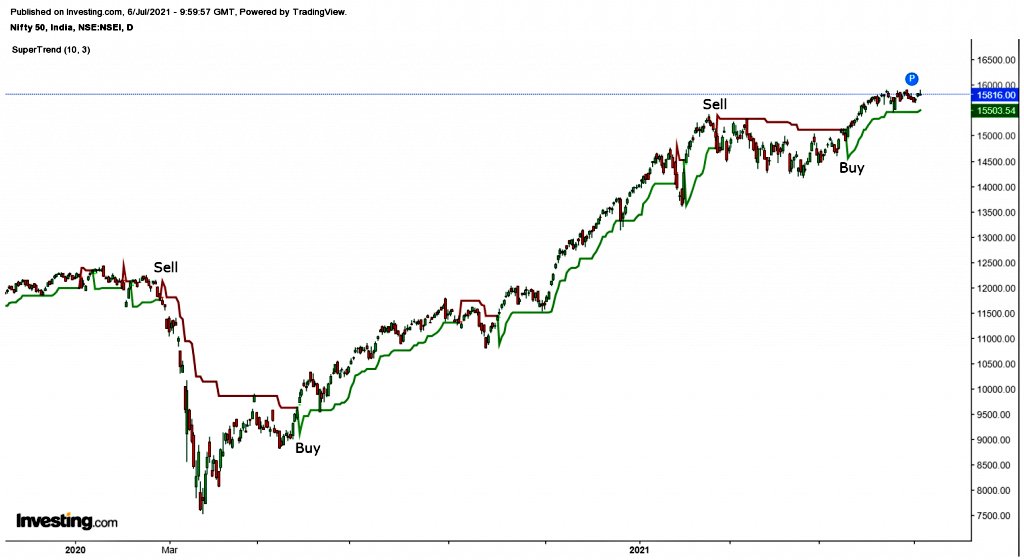
2. Supertrend: Supertrend is a market indicator that concludes if your price movement in a market is trending.
The Supertrend indicator can be plotted either above or below the closing price👇 (4/22)
The Supertrend indicator can be plotted either above or below the closing price👇 (4/22)

Based on the direction of the trend, the #Supertrend changes colour.
On closing below the closing price, the line turns green, indicating a buy signal.
Conversely, on closing above the closing price, the line turns red, indicating a sell signal (5/22)
On closing below the closing price, the line turns green, indicating a buy signal.
Conversely, on closing above the closing price, the line turns red, indicating a sell signal (5/22)
3. Parabolic SAR: Another indicator that is trusted by Traders all over the world.
On a chart, this indicator looks like a series of dots placed above/below the price bars👇 (6/22)
On a chart, this indicator looks like a series of dots placed above/below the price bars👇 (6/22)
When the dots reverse, it indicates a potential change in the price direction, as shown in the figure👇 (8/22)
4. On-Balance-Volume(OBV): A very unique indicator. It can be used both as a trend as well as a Volume indicator. (9/22)
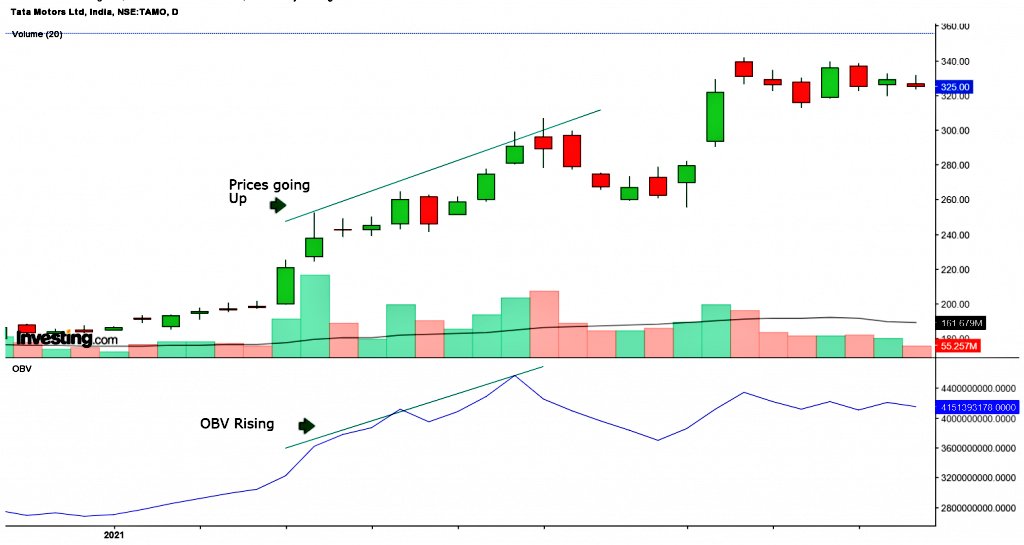
OBV Calculates the cumulative buying and selling pressure by adding the volume on Bullish days and subtracting it on Bearish days👇 (10/22)
However, the #volume must confirm trends. A rise in the price should be accompanied by a rising OBV, vice-versa👇 (11/22)
5. Moving Average Convergence, Divergence(MACD): This indicator consists of the MACD and a signal line.
The Signal Line crossovers provide buy/sell signals to traders (12/22)
The Signal Line crossovers provide buy/sell signals to traders (12/22)
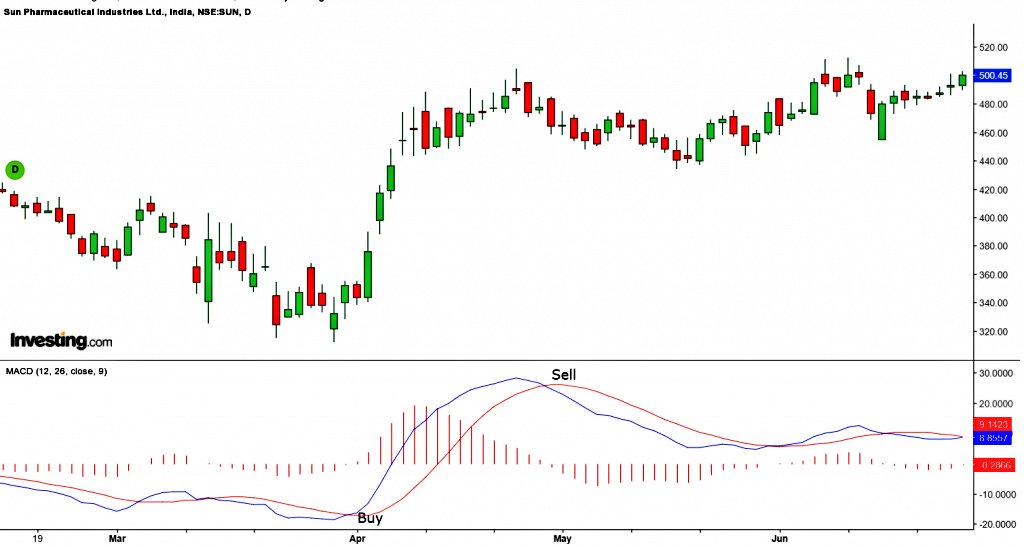
A buy signal occurs when the MACD line crosses above the signal, and a sell signal occurs when the MACD line crosses below the signal line👇
Read The Blog Here: sedg.in (13/22)
Read The Blog Here: sedg.in (13/22)

Don't miss out on our biggest event of the year, with 6 eminent mentors!
Enroll for Super Six here (14/22)
Enroll for Super Six here (14/22)

2. Sivakumar Jayachandran(@Justsiva123):sedg.in Open & High Strategy in Index #Options & #Futures (17/22)

3. Vijay Thakare (@VijaySThakare): sedg.in Introduction to Algo Candles and Patterns (22/22)
Book your seat for 2 days and get a Rs.2800 OFF!
sedg.in
sedg.in
Loading suggestions...