

#ADX is an #indicator which is used for trading in the stock market.
This learning thread would be on
"𝙐𝙨𝙚𝙨 𝙤𝙛 𝘼𝘿𝙓"
Like👍 & Retweet🔄for wider reach and for more such learning thread in the future.
Also, some strategies are shared related to ADX in the end.
1/7
This learning thread would be on
"𝙐𝙨𝙚𝙨 𝙤𝙛 𝘼𝘿𝙓"
Like👍 & Retweet🔄for wider reach and for more such learning thread in the future.
Also, some strategies are shared related to ADX in the end.
1/7
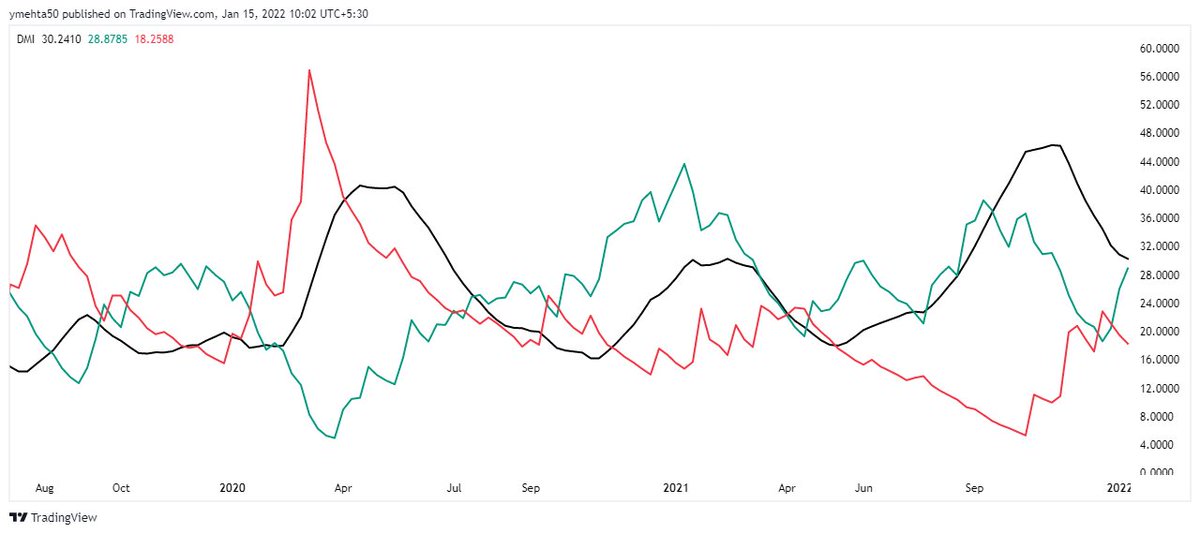
Before starting with ADX, let's see how does it looks like.
It's also called as DMI in @tradingview.
There are three lines:
ADX (Main Line)- Black Colour
DI+ Green Colour
DI- Black Colour
investopedia.com
2/7
It's also called as DMI in @tradingview.
There are three lines:
ADX (Main Line)- Black Colour
DI+ Green Colour
DI- Black Colour
investopedia.com
2/7
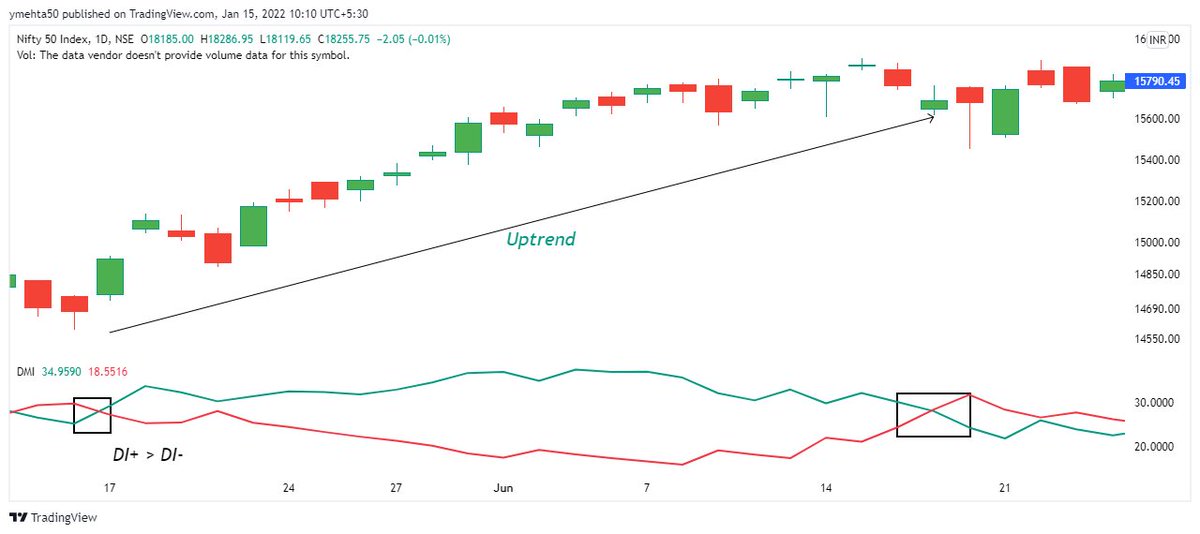
1⃣ Using ADX to find Direction of Market
As of now, let's ignore Adx Main line (Black) and let's focus on green (DI+) and red line (DI-).
📈Bullish Trend:
When DI+ crosses above DI- the trend is bullish.
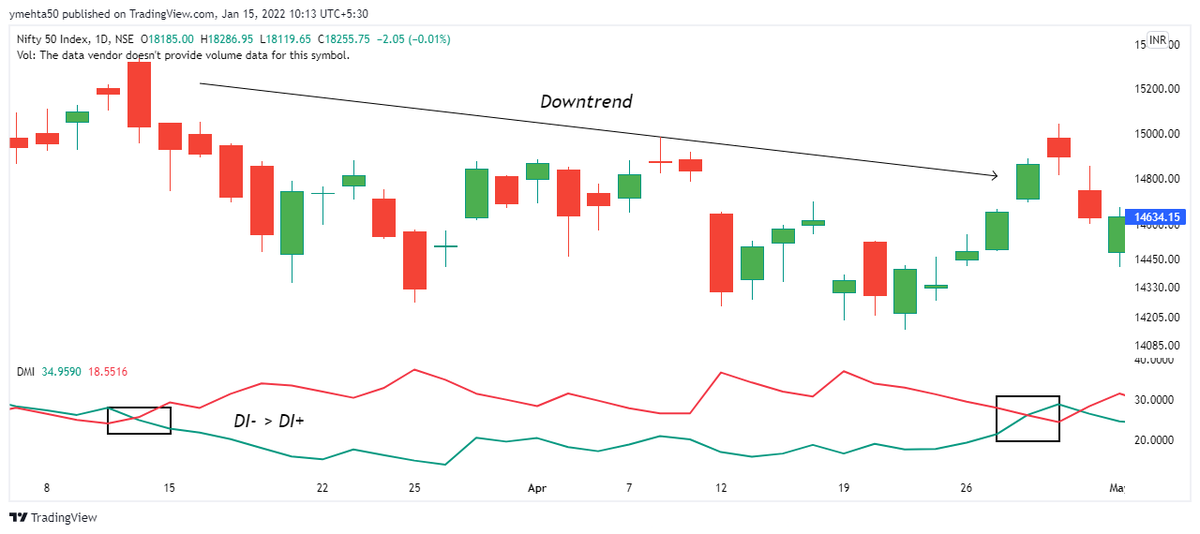
📉Bearish Trend:
When DI- crosses above DI+ the trend is bullish
3/7
As of now, let's ignore Adx Main line (Black) and let's focus on green (DI+) and red line (DI-).
📈Bullish Trend:
When DI+ crosses above DI- the trend is bullish.
📉Bearish Trend:
When DI- crosses above DI+ the trend is bullish
3/7
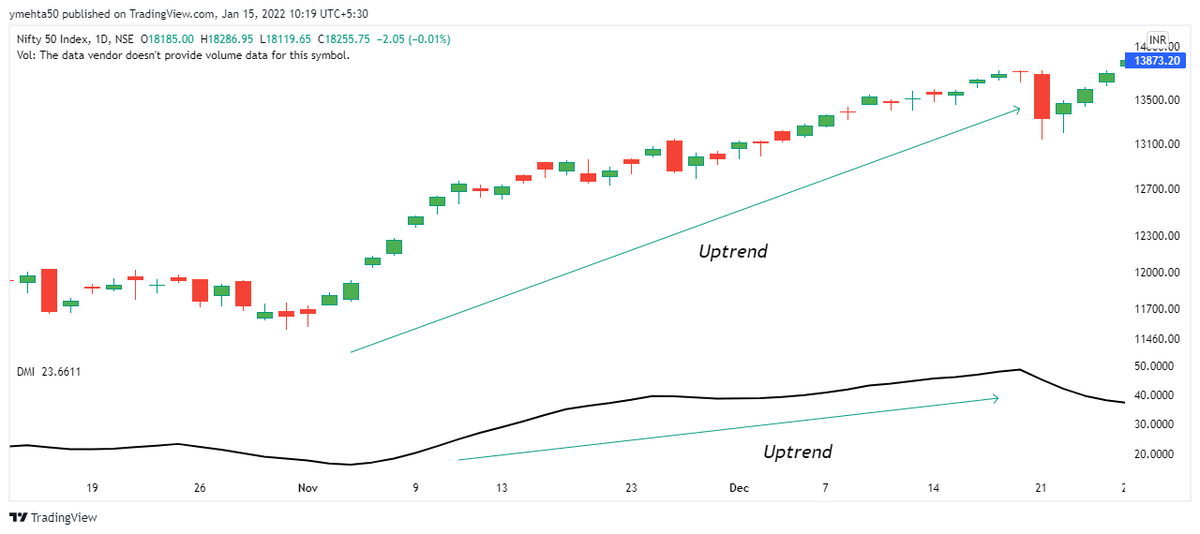
2⃣Using ADX to find out momentum/consolidation
As of now, let's ignore green (DI+) and red line (DI-) and let's focus on ADX main line (black).
Finding Momentum:
When ADX line is in the uptrend or slope is up, then there is a momentum in the stock/index.
4/7
As of now, let's ignore green (DI+) and red line (DI-) and let's focus on ADX main line (black).
Finding Momentum:
When ADX line is in the uptrend or slope is up, then there is a momentum in the stock/index.
4/7
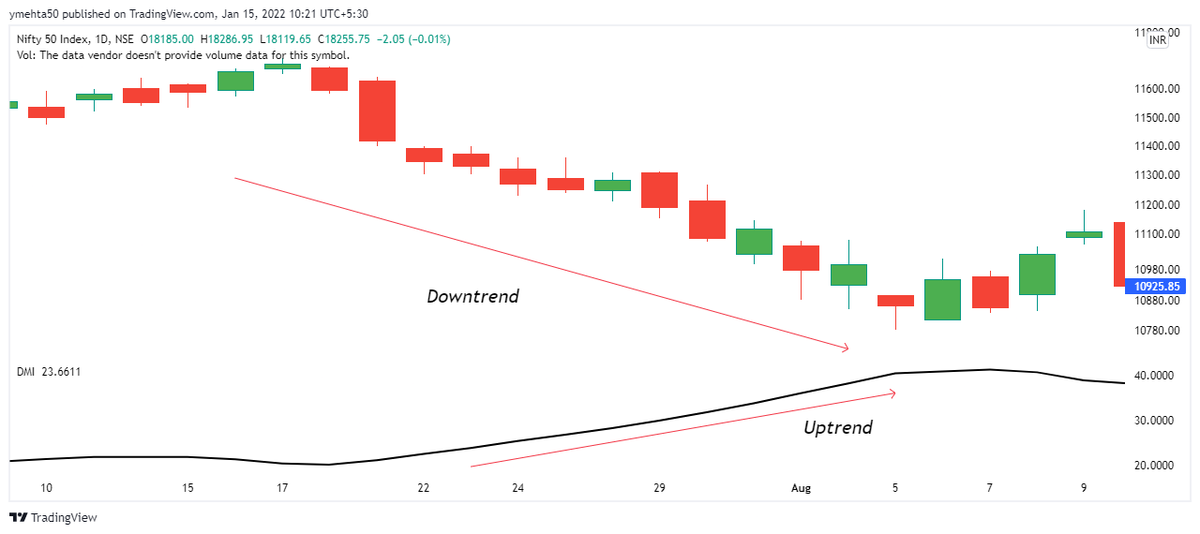
In Momentum, Direction can be either up or down.
Sharing charts example for both uptrend and downtrend.
First chart shows momentum is in uptrend as ADX is upward sloping.
Second chart shows momentum is in downtrend as ADX is upward sloping.
5/7
Sharing charts example for both uptrend and downtrend.
First chart shows momentum is in uptrend as ADX is upward sloping.
Second chart shows momentum is in downtrend as ADX is upward sloping.
5/7
We have identified both the uses of ADX.
Let's combine both to find out direction and momentum.
⚡️Bullish Momentum:
1. DI+ crosses above DI-
2. ADX sloping upward
⚡️Bearish Momentum:
1. DI- crosses above DI+
2. ADX sloping upward
⚡️Consolidation:
1. ADX sloping downward
6/7
Let's combine both to find out direction and momentum.
⚡️Bullish Momentum:
1. DI+ crosses above DI-
2. ADX sloping upward
⚡️Bearish Momentum:
1. DI- crosses above DI+
2. ADX sloping upward
⚡️Consolidation:
1. ADX sloping downward
6/7
I hope everyone understood how ADX can be used.
These are not a universal rules one must follow. One can create their rule or follow someone else rules.
Only important thing is one must follow a fix rule instead of tweaking or changing setup frequently.
7/7
These are not a universal rules one must follow. One can create their rule or follow someone else rules.
Only important thing is one must follow a fix rule instead of tweaking or changing setup frequently.
7/7
Loading suggestions...