

#WeeklyIndexCheck CW01/2022
Market status changed to Confirmed Uptrend. Momentum still negative but improving.
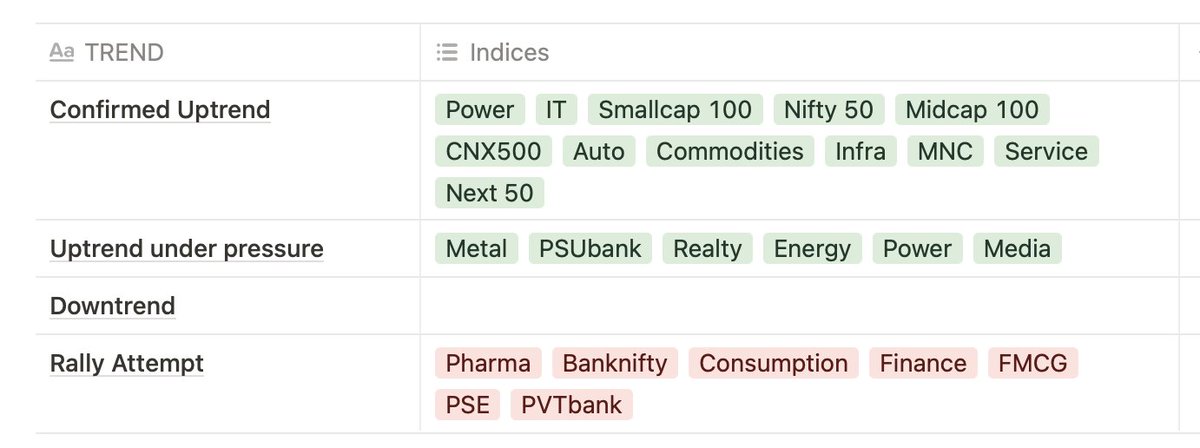
Most indices back in confirmed uptrend. Pharma & Banknifty in rally attempt. No index in downtrend.
Market breadth improving on all timeframes. Nearing overbought.
Market status changed to Confirmed Uptrend. Momentum still negative but improving.
Most indices back in confirmed uptrend. Pharma & Banknifty in rally attempt. No index in downtrend.
Market breadth improving on all timeframes. Nearing overbought.
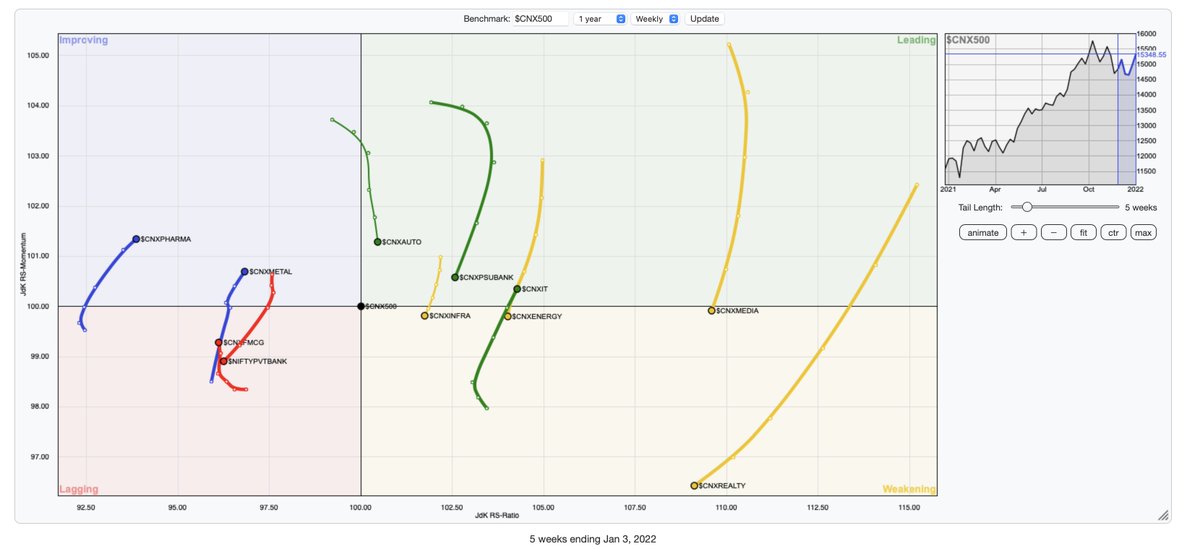
On Weekly RRG charts, compared to CNX500:
⦿ IT is again the new market leader.
⦿ Pharma & Metals improving strength & momentum.
⦿ Infra, Energy & Media now in the weakening quadrant.
⦿ Auto & Banks drop further.
⦿ IT is again the new market leader.
⦿ Pharma & Metals improving strength & momentum.
⦿ Infra, Energy & Media now in the weakening quadrant.
⦿ Auto & Banks drop further.
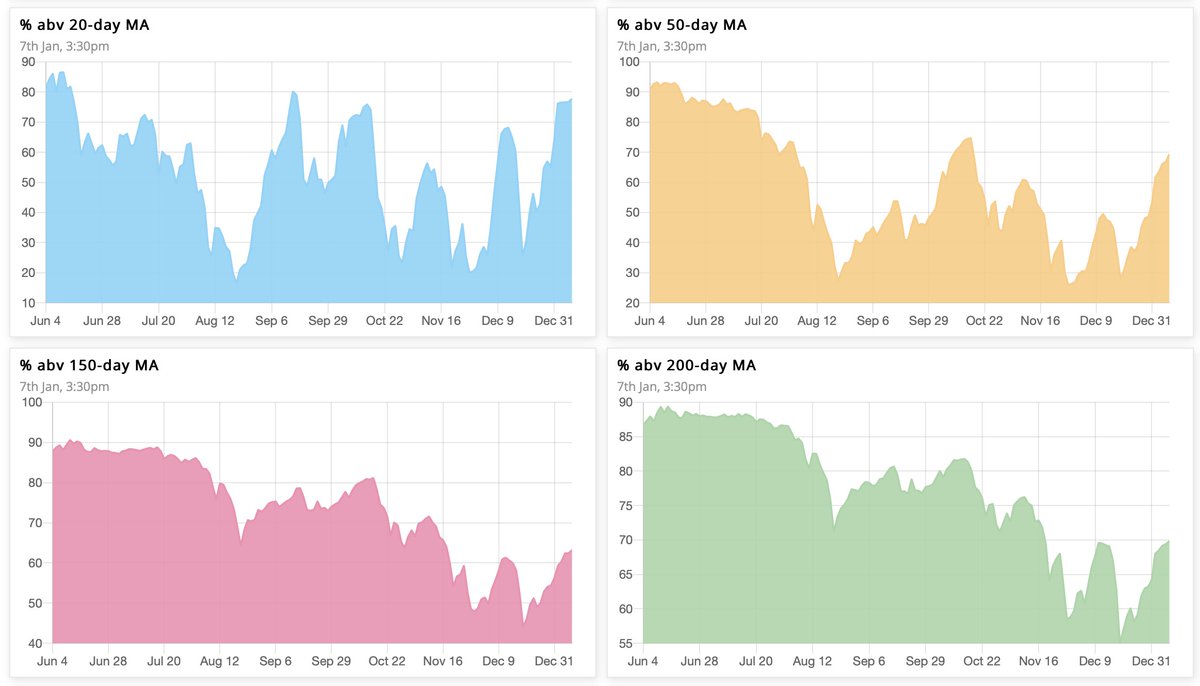
Market breadth strong on all timeframes. Short-term timeframes nearing overbought levels.
⦿ 63% → 77% above 20MA (nearing overbought)
⦿ 52% → 69% above 50MA (buy signal)
⦿ 55% → 63% above 150MA (bullish bias)
⦿ 64% → 69% above 200MA (bullish bias)
⦿ 63% → 77% above 20MA (nearing overbought)
⦿ 52% → 69% above 50MA (buy signal)
⦿ 55% → 63% above 150MA (bullish bias)
⦿ 64% → 69% above 200MA (bullish bias)
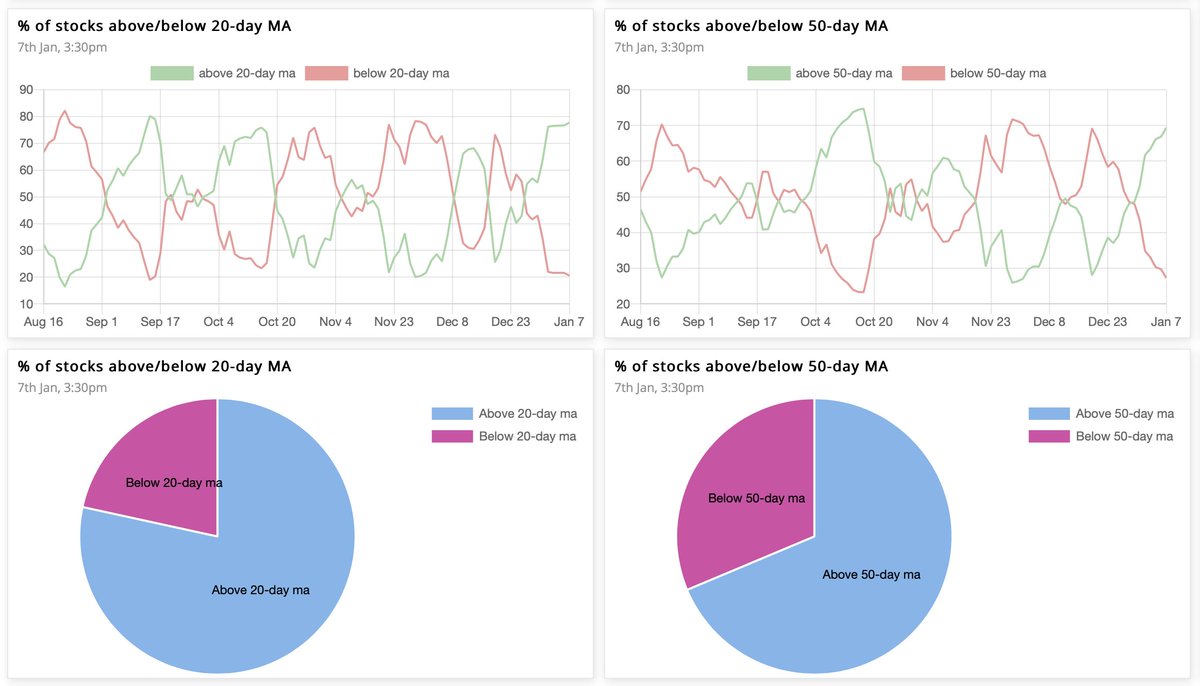
The Ratio between stocks above & below 50MA is 2.1, while that for 20MA is 3.6. The 10-day cumulative ratio for stocks above 50MA is 0.9.
A value >2 is good for swing trades on the long side.
A value >2 is good for swing trades on the long side.
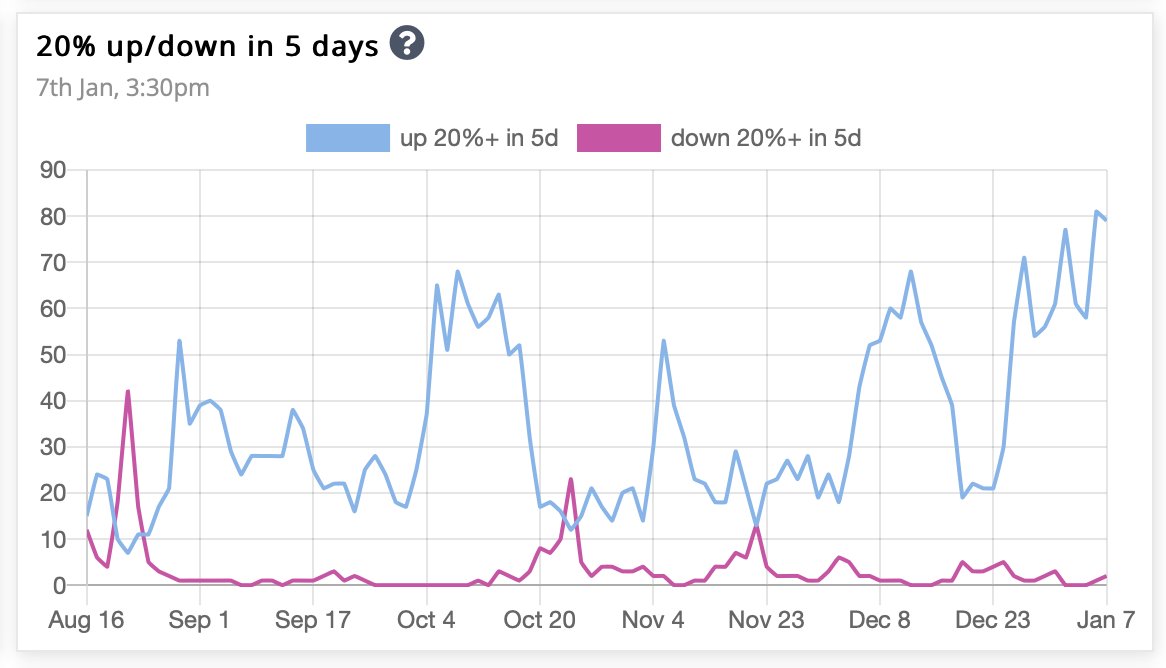
The number of stocks up 20% in past 5 days continues to be in strong bullish upthrust. Conducive environment for swing trades. A breather is due.
On a modified Stockbee market monitor, both 5-day & 10-day cumulative ratios are 6.3 and the 10-DCR to 1.5. Value more than 2 keeps it green.
Number of stocks up 13% in 34 days stays in green, which shows that the short-term phase continues to be bullish.
Number of stocks up 13% in 34 days stays in green, which shows that the short-term phase continues to be bullish.

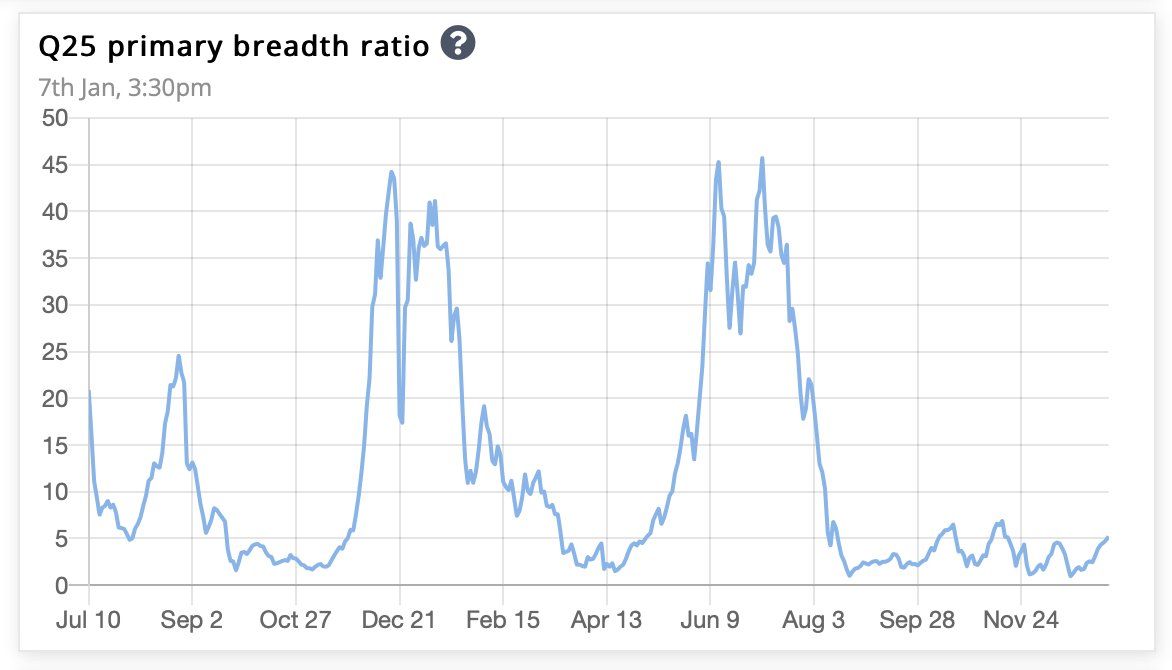
Overall, the market is bullish till the number of stocks up 25% plus in a quarter is more than that down 25% plus in a quarter.
The ratio between the two is the primary breadth ratio, which is 5.2 now.
The ratio between the two is the primary breadth ratio, which is 5.2 now.
Loading suggestions...