

#Volatility #Contraction is one of my favourite setup in short term trading.
This thread would be on "𝙑𝙤𝙡𝙖𝙩𝙞𝙡𝙞𝙩𝙮 𝙏𝙧𝙖𝙙𝙞𝙣𝙜 𝙎𝙚𝙩𝙪𝙥"
In the end, screener and indicator on @tradingview is shared.
Like👍 & Retweet🔄for more such thread in the future.
1/13
This thread would be on "𝙑𝙤𝙡𝙖𝙩𝙞𝙡𝙞𝙩𝙮 𝙏𝙧𝙖𝙙𝙞𝙣𝙜 𝙎𝙚𝙩𝙪𝙥"
In the end, screener and indicator on @tradingview is shared.
Like👍 & Retweet🔄for more such thread in the future.
1/13

Before beginning with this thread, just some point to note.
Volatility Contraction is simple setup to trade and all the traders have their own trading setup.
All setup are equally good but this thread and setup would based on my setup which I have built with experience.
2/13
Volatility Contraction is simple setup to trade and all the traders have their own trading setup.
All setup are equally good but this thread and setup would based on my setup which I have built with experience.
2/13
Let's begin with the setup.
Setup:
1. Identify a big candle either bullish or bearish which have less wick.
2. Volume of this candle should be above average
3. After that atleast three entire candle should form inside the range of that big candle
3/13
Setup:
1. Identify a big candle either bullish or bearish which have less wick.
2. Volume of this candle should be above average
3. After that atleast three entire candle should form inside the range of that big candle
3/13
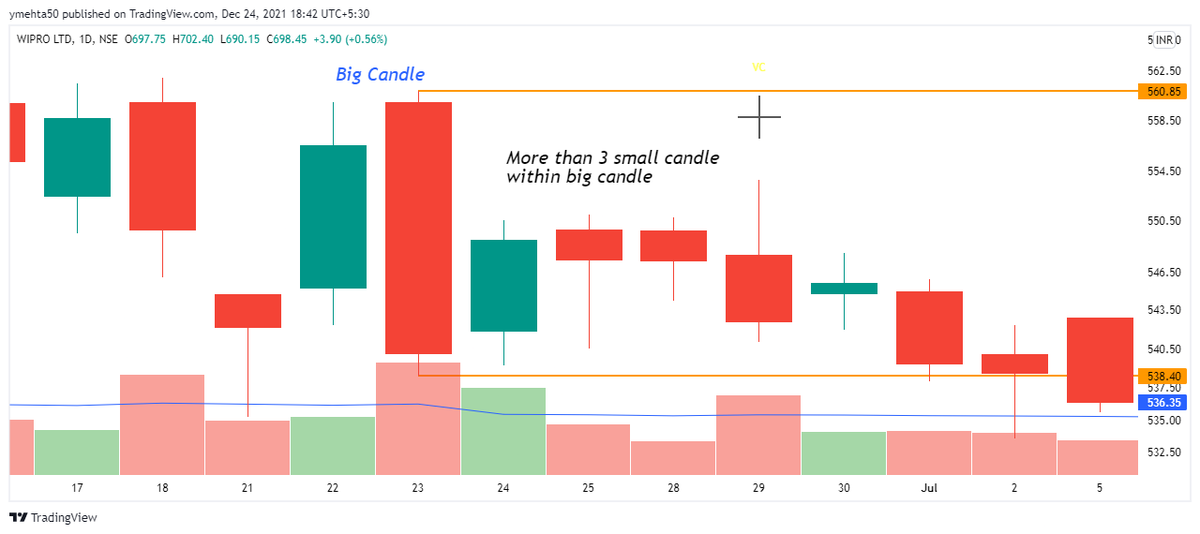
4. Wait for breakout above high of the big candle with good volumes
5. Stoploss will be low of the same big candle and trail SL as per your setup
6. Target Risk:Reward of atleast 1:1
7. Stock can be in any trend
8. Use Daily/Weekly/Monthly Time frame
4/13
5. Stoploss will be low of the same big candle and trail SL as per your setup
6. Target Risk:Reward of atleast 1:1
7. Stock can be in any trend
8. Use Daily/Weekly/Monthly Time frame
4/13
Let's see some live case or examples.
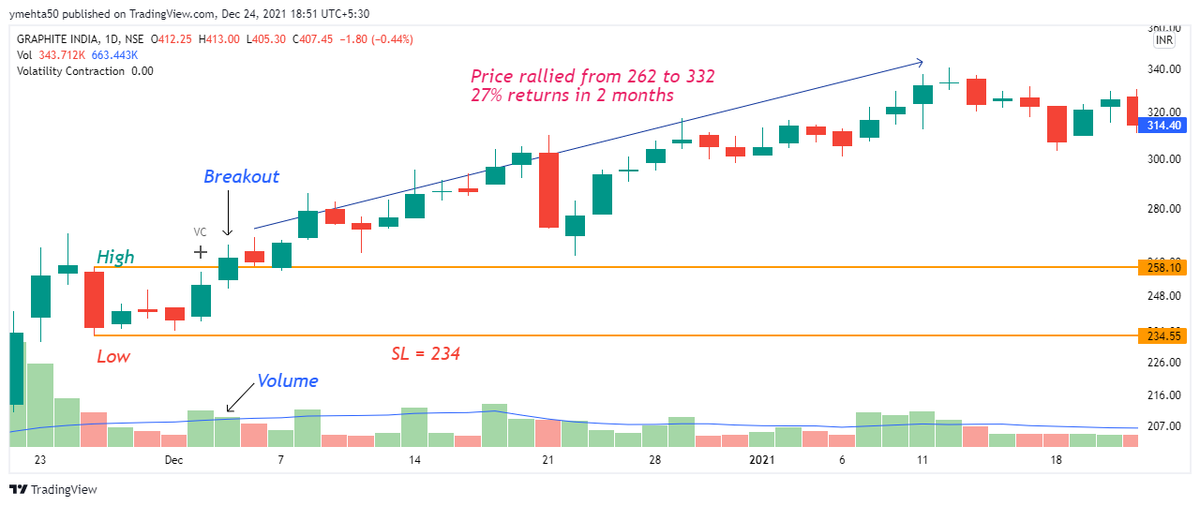
Graphite Daily Chart.
After satisfying all the criteria of candle formation and a breakout above big candle high.
After that stock had rallied from 262 to 332 which is almost 27% returns in short term. Risk in this trade was 11%.
5/13
Graphite Daily Chart.
After satisfying all the criteria of candle formation and a breakout above big candle high.
After that stock had rallied from 262 to 332 which is almost 27% returns in short term. Risk in this trade was 11%.
5/13
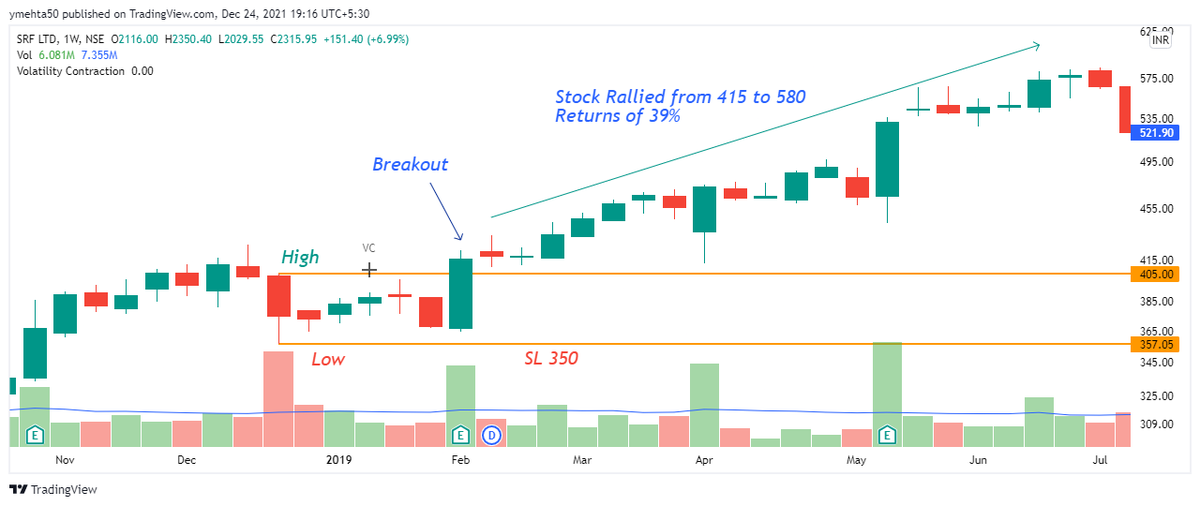
#SRF Weekly Chart.
It formed Volatility Contraction pattern and gave breakout above high.
After that stock had rallied from 415 to 580in short term.
Returns of 39% and Risk in this trade was 10%.
6/13
It formed Volatility Contraction pattern and gave breakout above high.
After that stock had rallied from 415 to 580in short term.
Returns of 39% and Risk in this trade was 10%.
6/13
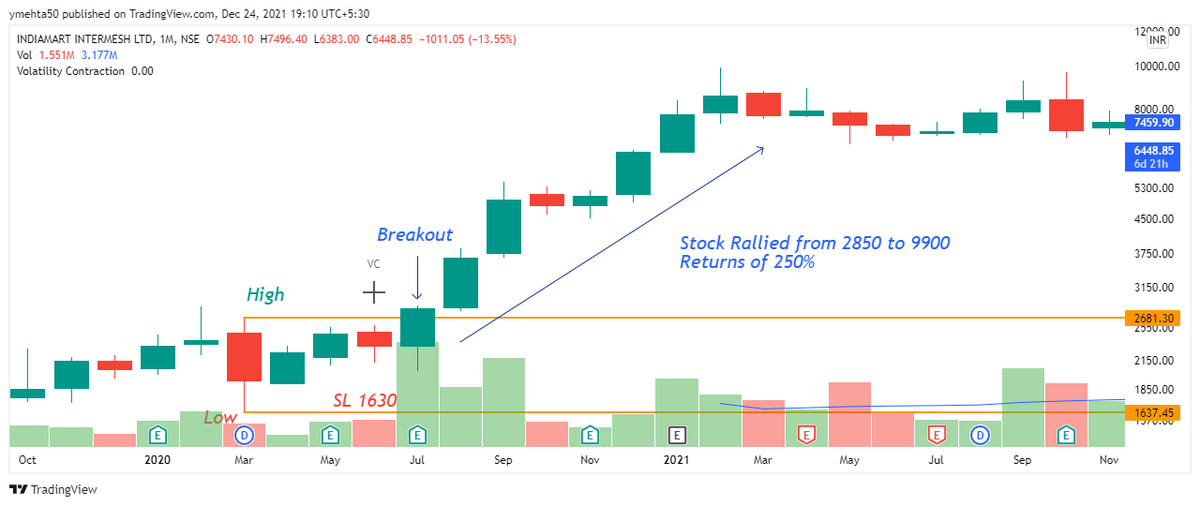
#IndiaMart Monthly Chart.
It formed Volatility Contraction pattern and gave breakout above high.
After that stock had rallied from 2850 to 9900 in six months.
Returns of 250% and Risk in this trade was 43% which is very high. So position sizing is important here.
7/13
It formed Volatility Contraction pattern and gave breakout above high.
After that stock had rallied from 2850 to 9900 in six months.
Returns of 250% and Risk in this trade was 43% which is very high. So position sizing is important here.
7/13
So I have showed setup in all the time frame which is Daily, Weekly and Monthly. Use this setup in any other time frame after backtesting it.
Breakout above big candle can happen after any number of candle only condition there should be atleast 3 small candles formed.
8/13
Breakout above big candle can happen after any number of candle only condition there should be atleast 3 small candles formed.
8/13
This setup focuses only on buy side. In case you want to trade on sell side then look for breakdown below low of the big candle. I would suggest to backtest it properly before taking any short side trade.
Risk in trade will increase as time frame is increased.
9/13
Risk in trade will increase as time frame is increased.
9/13
Now important part.
I have created scanners related to the same on Chartink.
Daily Volatility Contraction: chartink.com
Weekly Volatility Contraction: chartink.com
You can create screener for monthly time frame and share it with others.
10/13
I have created scanners related to the same on Chartink.
Daily Volatility Contraction: chartink.com
Weekly Volatility Contraction: chartink.com
You can create screener for monthly time frame and share it with others.
10/13

chartink.com/screener/volat…
Volatility Contraction Weekly, Technical Analysis Scanner
After contraction, there is expansion in stocks, depending on PA and breakout, trade in that directi...

chartink.com/screener/volat…
Volatility Contraction, Technical Analysis Scanner
Technical & Fundamental stock screener, scan stocks based on rsi, pe, macd, breakouts, divergence, g...
I have created Volatility Contraction #Indicator on @tradingview and it is open sourced.
Use this link to add the indicator:
in.tradingview.com
It will mark Volatility Contraction (VC) candle automatically on chart and it will adjust according to the time frame.
11/13
Use this link to add the indicator:
in.tradingview.com
It will mark Volatility Contraction (VC) candle automatically on chart and it will adjust according to the time frame.
11/13

I use Daily time frame for swing trading, Weekly time frame for positional trading and Monthly time frame for investment.
Higher time frame -> Higher Risk -> Higher Reward -> More Patience
12/13
Higher time frame -> Higher Risk -> Higher Reward -> More Patience
12/13
I hope everyone understood of how I trade based on Volatility Contraction Patterns.
These are not a universal rules. One can create their rule or follow someone else rules.
I would answer all the queries of our friends so do mention it in the comment.
Like and Retweet.
13/13
These are not a universal rules. One can create their rule or follow someone else rules.
I would answer all the queries of our friends so do mention it in the comment.
Like and Retweet.
13/13
Loading suggestions...