

#WeeklyIndexCheck CW50/2021
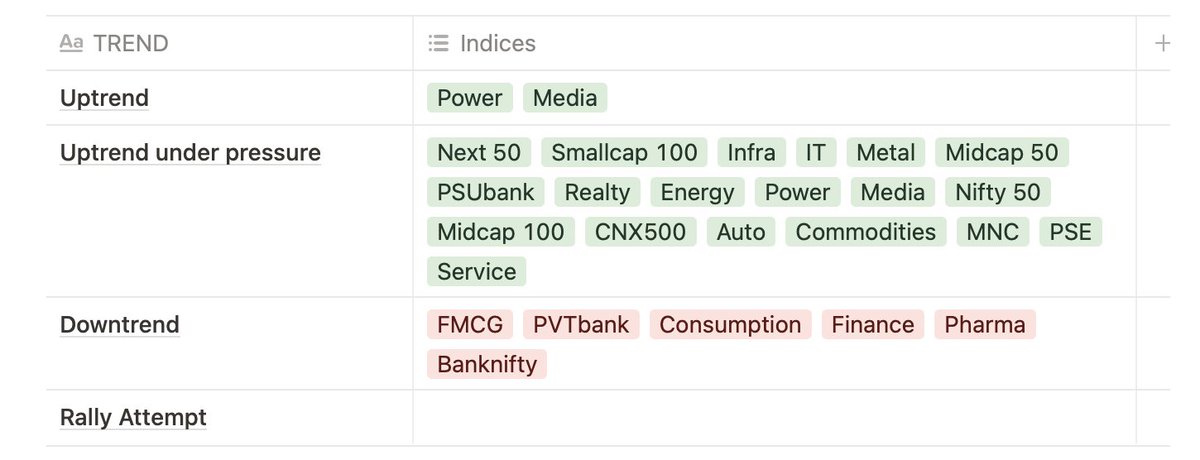
Uptrend under pressure.
Except Power & Media, none of the indices in confirmed uptrend or with positive momentum.
Market breadth weakening. Last week’s buying signal on short-term charts turned out to be a bull trap.
Uptrend under pressure.
Except Power & Media, none of the indices in confirmed uptrend or with positive momentum.
Market breadth weakening. Last week’s buying signal on short-term charts turned out to be a bull trap.
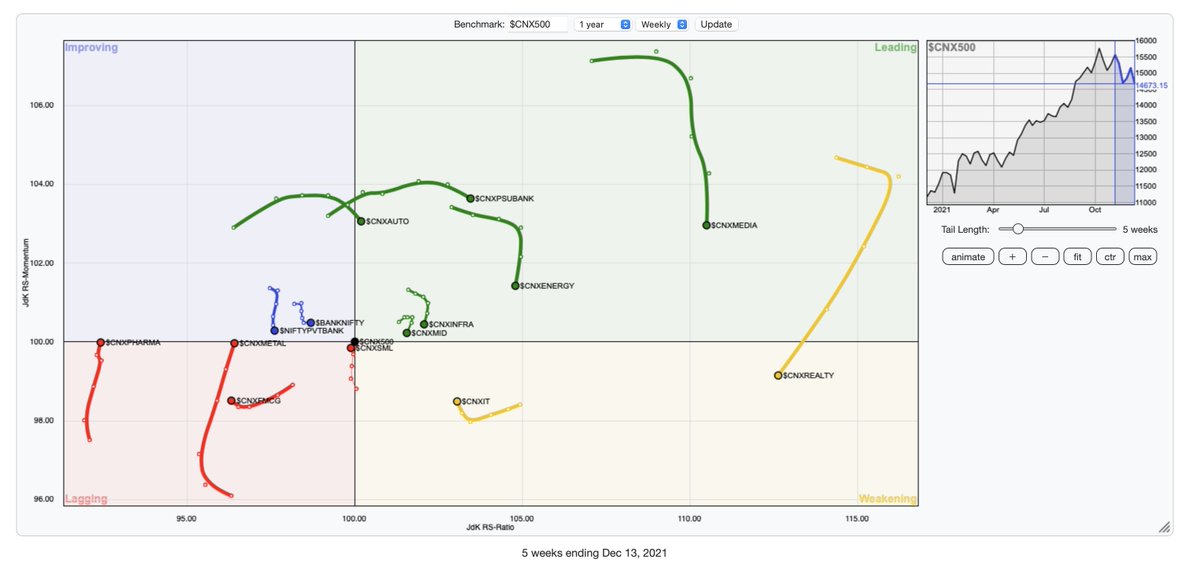
On Weekly RRG charts, compared to CNX500:
⦿ Except IT, Metals & Pharma, all indices are looking downwards (losing momentum)
⦿ Realty exits the leading quadrant
⦿ Metals have been consistently regaining momentum & strength
⦿ Except IT, Metals & Pharma, all indices are looking downwards (losing momentum)
⦿ Realty exits the leading quadrant
⦿ Metals have been consistently regaining momentum & strength
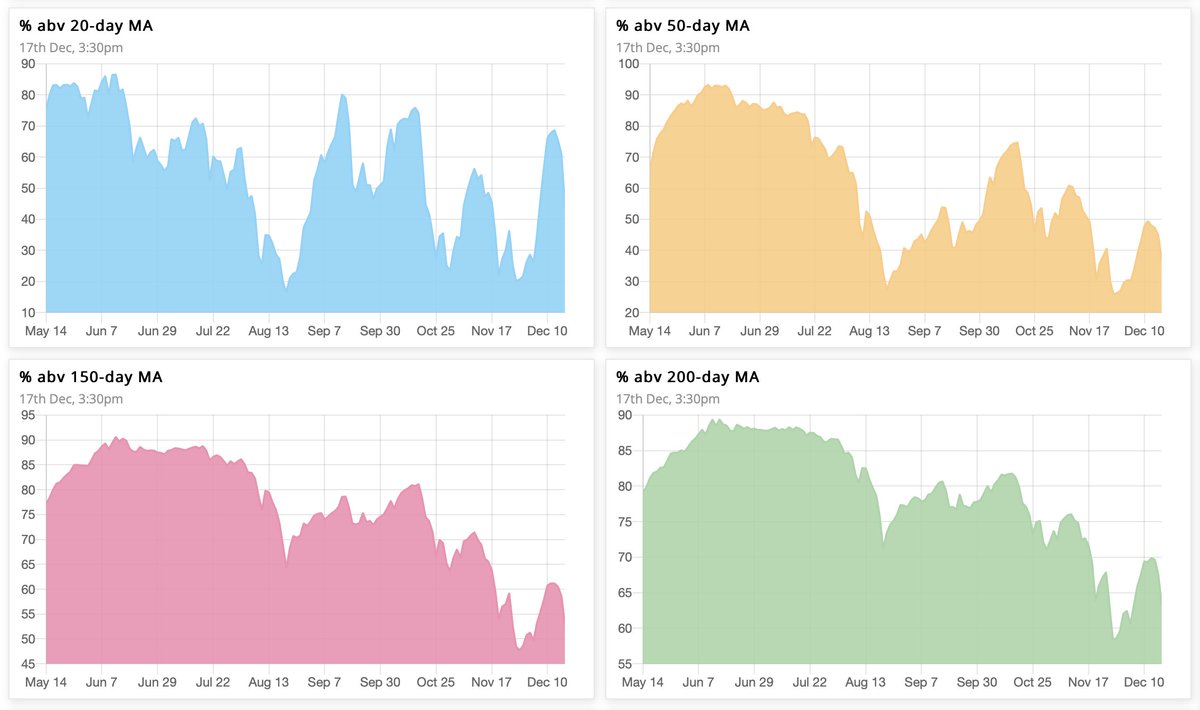
Market breadth weakening on all timeframes. Far from oversold, so can move a long distance either way.
⦿ 65% → 43% above 20 SMA (weakening)
⦿ 46% → 36% above 50 SMA (weakening)
⦿ 59% → 52% above 150 SMA (bullish bias)
⦿ 68% → 63% above 200 SMA (bullish bias)
⦿ 65% → 43% above 20 SMA (weakening)
⦿ 46% → 36% above 50 SMA (weakening)
⦿ 59% → 52% above 150 SMA (bullish bias)
⦿ 68% → 63% above 200 SMA (bullish bias)
The Ratio between stocks above & below 50MA is 0.4, while that for 20MA is 0.6. The 10-day cumulative ratio for stocks above 50MA is 0.5.
A value >2 is good for swing trades on the long side.
A value >2 is good for swing trades on the long side.

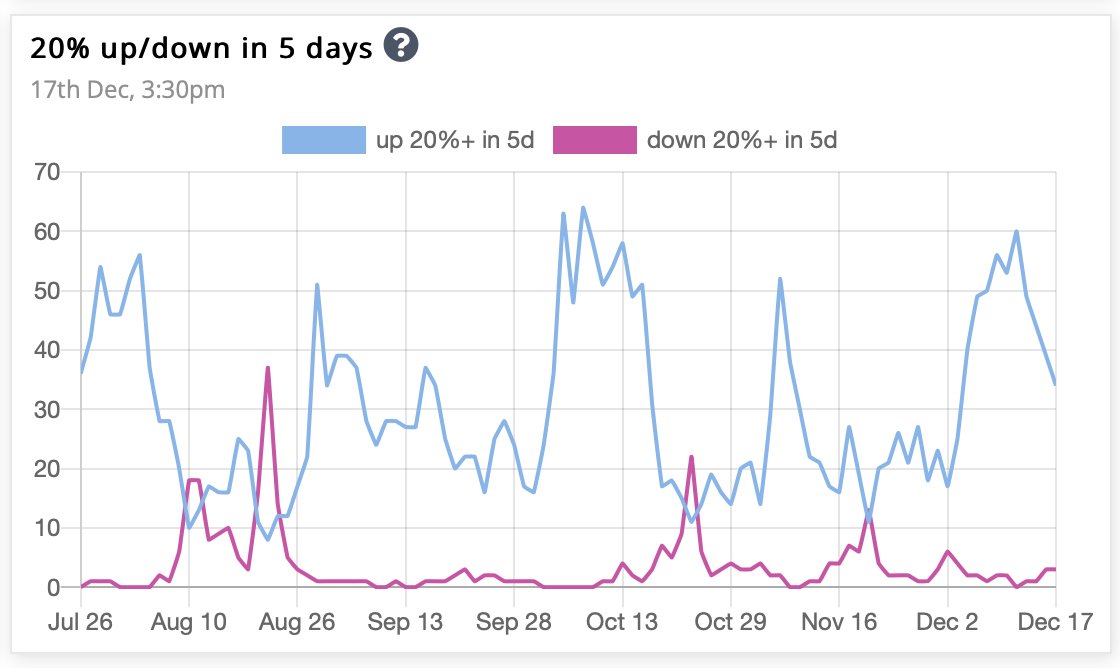
After last week’s bullish upthrust, the number of stocks up 20% in past 5 days undergoes a nosedive.
For good swing trades, we need this number to stay up for at least a couple of days, as it did in the first half of October.
For good swing trades, we need this number to stay up for at least a couple of days, as it did in the first half of October.
On a modified Stockbee market monitor, the 5-day cumulative ratio is down to 1 and the 10-DCR down to 2. Value more than 2 makes it green.
Number of stocks up 13% in 34 days is now back in red, which shows that the short-term bearish phase is back.
Number of stocks up 13% in 34 days is now back in red, which shows that the short-term bearish phase is back.
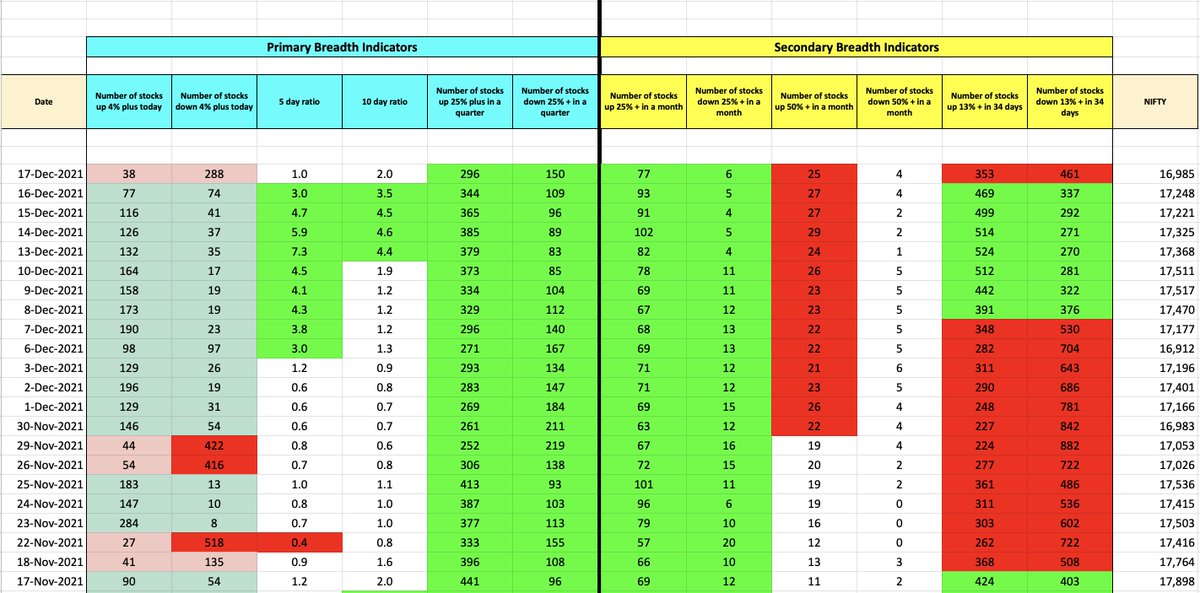
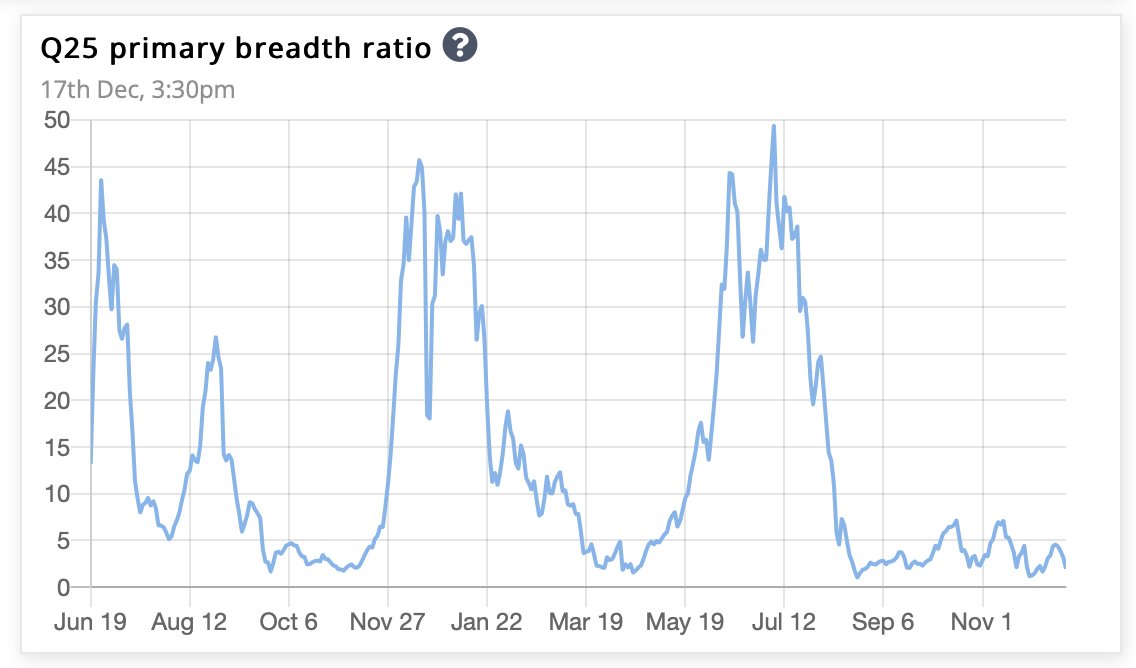
Overall, the market is bullish till the number of stocks up 25% plus in a quarter is more than that down 25% plus in a quarter.
The ratio between the two is the primary breadth ratio, which has worsened to 1.97 (from 4.1), & has been in single digits since August 2021.
The ratio between the two is the primary breadth ratio, which has worsened to 1.97 (from 4.1), & has been in single digits since August 2021.
Loading suggestions...