

1/
How do you identify whether a stock/index is in an uptrend or a downtrend?
I use a modified Awesome Oscillator for this.
An “awesome" thread🧵 with a free Tradingview script in the end! 👇👇👇
How do you identify whether a stock/index is in an uptrend or a downtrend?
I use a modified Awesome Oscillator for this.
An “awesome" thread🧵 with a free Tradingview script in the end! 👇👇👇

2/
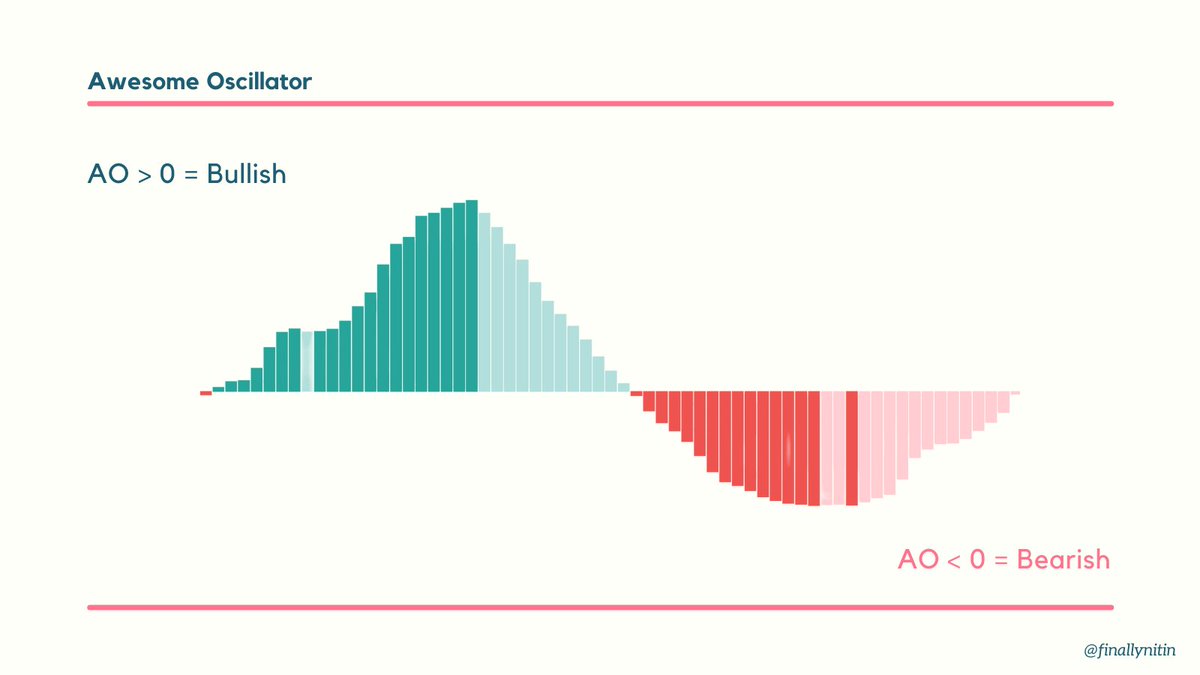
The Bill Williams' Awesome Oscillator calculates the difference between 34-period & 5-period SMAs.
⦿ If the Awesome Oscillator is above the zero line, it is considered bullish.
⦿ If the Awesome Oscillator is below the zero line, it is considered bearish.
The Bill Williams' Awesome Oscillator calculates the difference between 34-period & 5-period SMAs.
⦿ If the Awesome Oscillator is above the zero line, it is considered bullish.
⦿ If the Awesome Oscillator is below the zero line, it is considered bearish.
3/
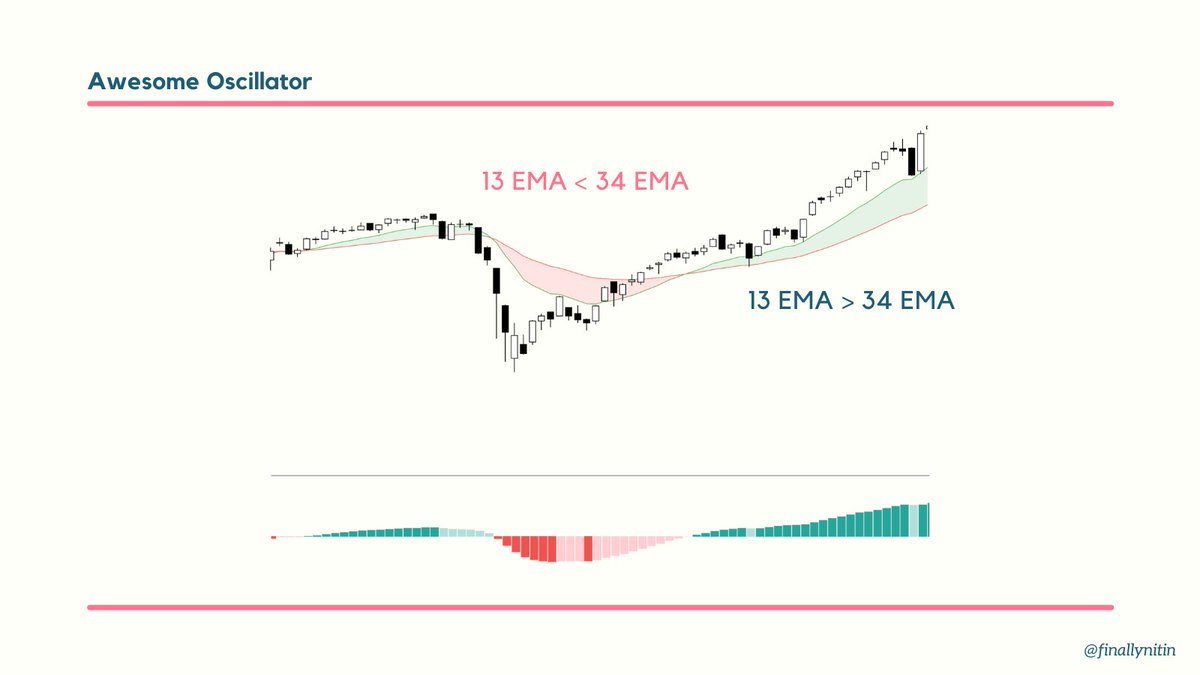
For our purpose, we’ll use 34 & 13 period EMAs.
⦿ If 13EMA is greater than 34EMA, then awesome oscillator is positive (above zero line), so trend is bullish.
⦿ If 13EMA is lesser than 34EMA, then awesome oscillator is negative (below zero line), so trend is bearish.
For our purpose, we’ll use 34 & 13 period EMAs.
⦿ If 13EMA is greater than 34EMA, then awesome oscillator is positive (above zero line), so trend is bullish.
⦿ If 13EMA is lesser than 34EMA, then awesome oscillator is negative (below zero line), so trend is bearish.
4/
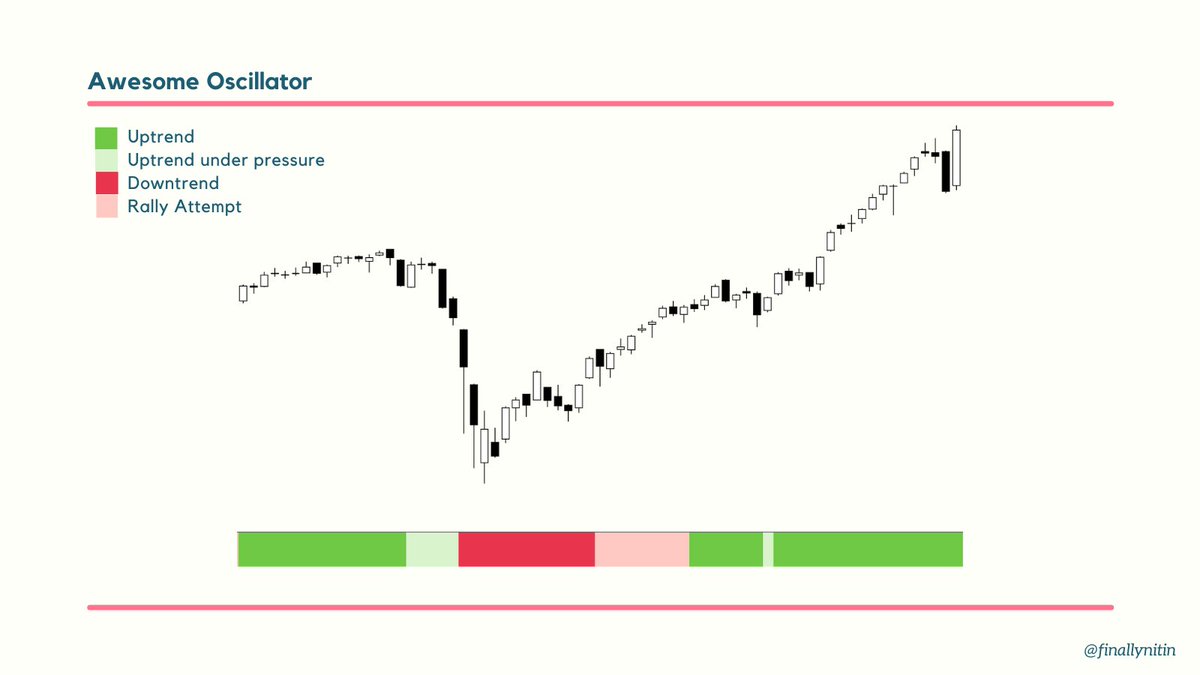
We use multi-timeframes, weekly (W) & daily (D), for trend determination.
⦿ AO positive on both D & W -> Uptrend
⦿ AO negative on D but positive on W -> Uptrend under pressure
⦿ AO negative on both D & W -> Downtrend
⦿ AO negative on W but positive on D -> Rally Attempt
We use multi-timeframes, weekly (W) & daily (D), for trend determination.
⦿ AO positive on both D & W -> Uptrend
⦿ AO negative on D but positive on W -> Uptrend under pressure
⦿ AO negative on both D & W -> Downtrend
⦿ AO negative on W but positive on D -> Rally Attempt
5/
I’ve made a Tradingview script for this.
Please note that the AO trend bar will work only on the weekly timeframe.
Hope this makes trend identification easier for you!
/End
tradingview.com
I’ve made a Tradingview script for this.
Please note that the AO trend bar will work only on the weekly timeframe.
Hope this makes trend identification easier for you!
/End
tradingview.com
Loading suggestions...