

#WeeklyIndexCheck CW48/2021
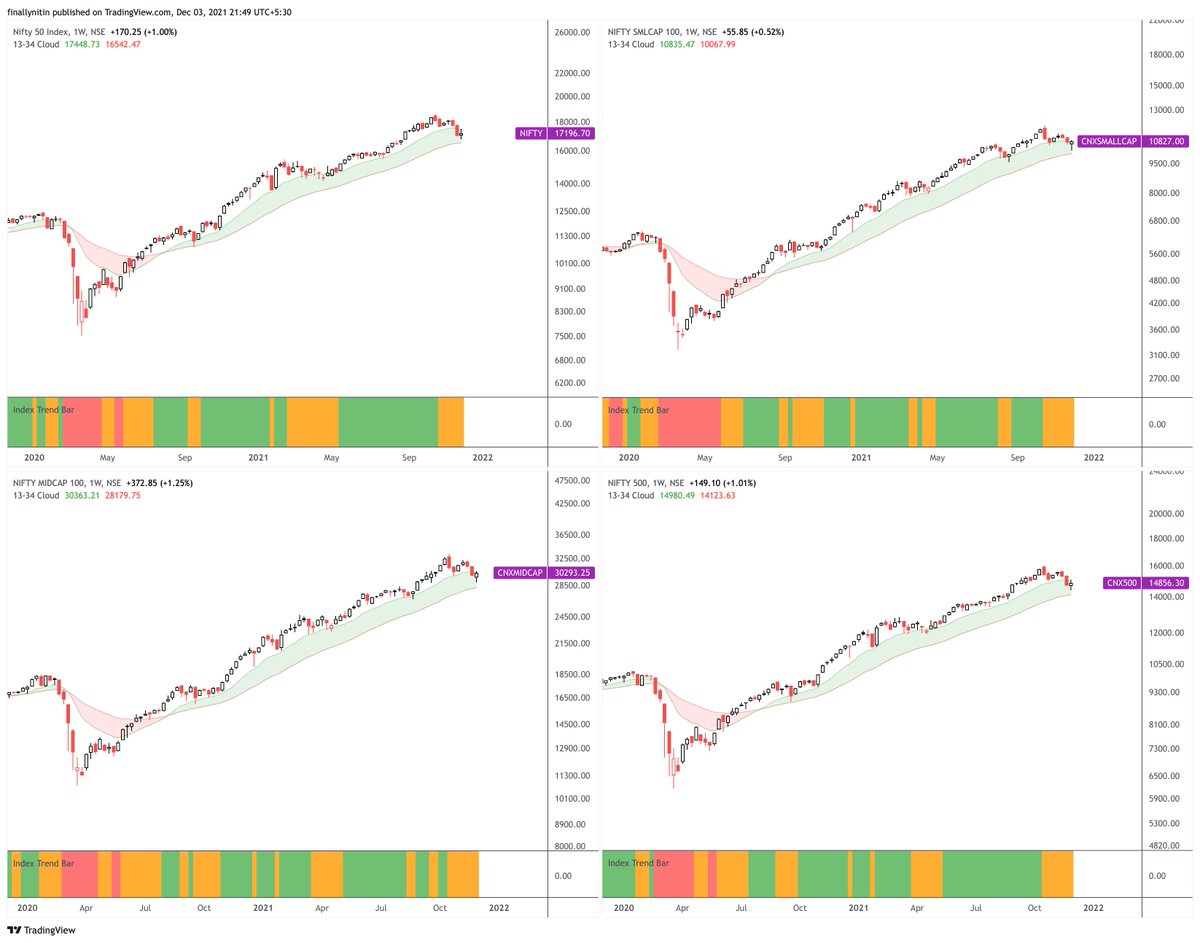
Short-term downtrend / Correction.
Momentum lost in most major indices, except Power & Media.
Market breadth worsening & nearing oversold.
Short-term downtrend / Correction.
Momentum lost in most major indices, except Power & Media.
Market breadth worsening & nearing oversold.
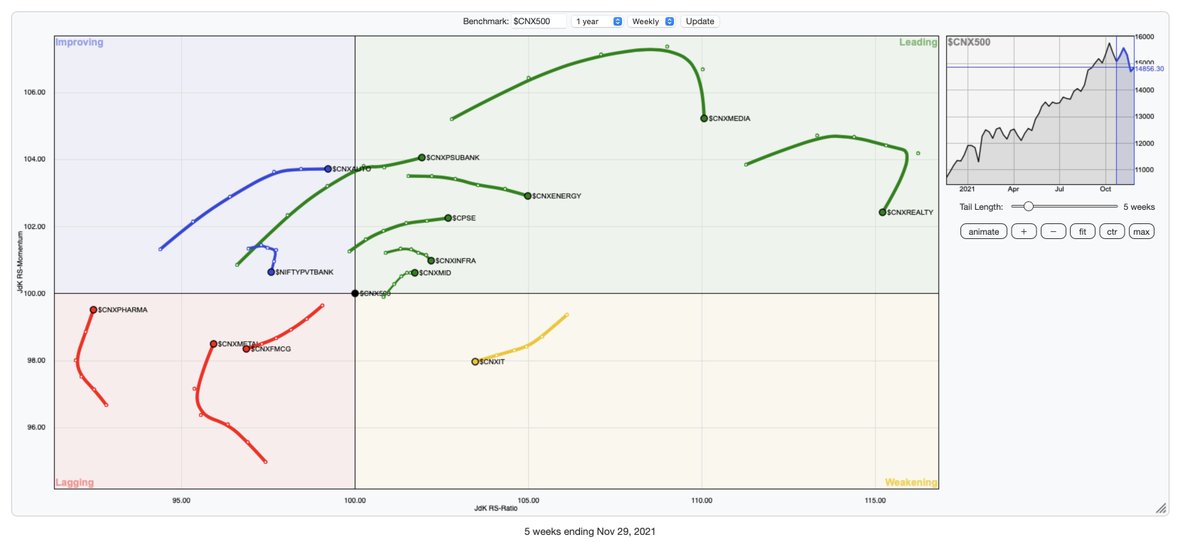
On Weekly RRG charts, compared to CNX500:
⦿ Most indices in the leading quadrant are looking downwards (losing momentum)
⦿ Autos & PSUbanks still managing to look good.
⦿ Pharma & Metals trying to gain momentum, but lack strength
⦿ FMCG is the weakest index
⦿ Most indices in the leading quadrant are looking downwards (losing momentum)
⦿ Autos & PSUbanks still managing to look good.
⦿ Pharma & Metals trying to gain momentum, but lack strength
⦿ FMCG is the weakest index
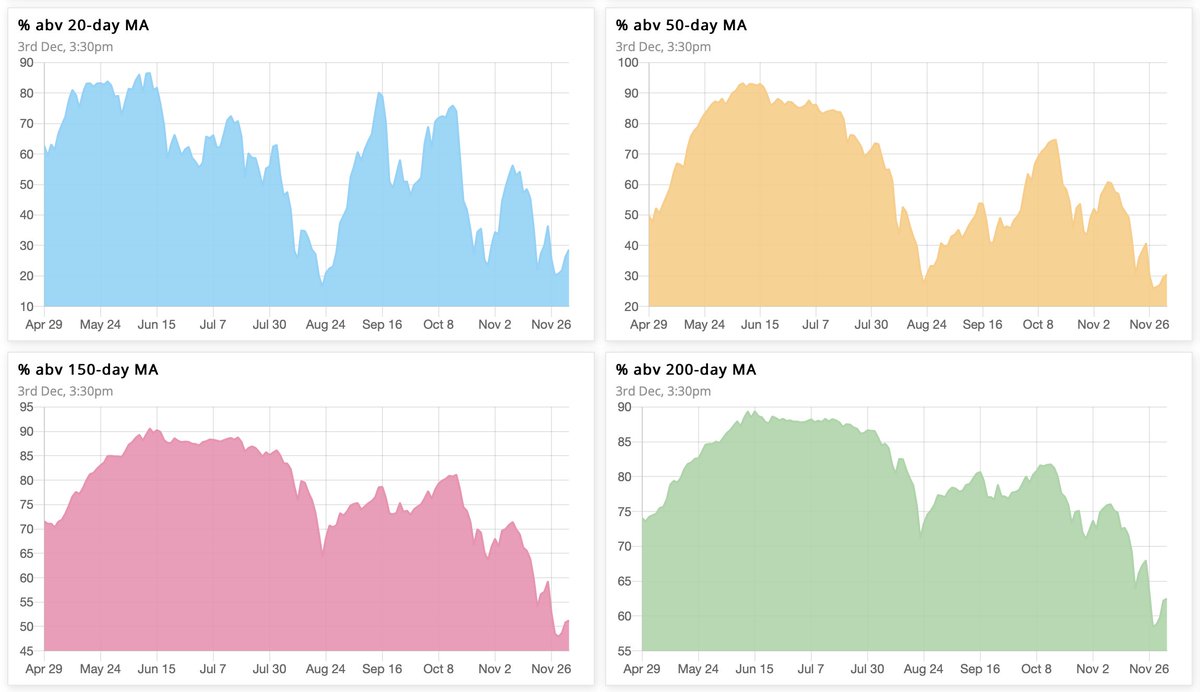
Market breadth stays weak on all timeframes. Nearing oversold levels on short-term charts.
⦿ 25% → 28% above 20 SMA (nearing oversold)
⦿ 30% → 30% above 50 SMA (nearing oversold)
⦿ 52% → 51% above 150 SMA (bullish bias)
⦿ 63% → 63% above 200 SMA (bullish bias)
⦿ 25% → 28% above 20 SMA (nearing oversold)
⦿ 30% → 30% above 50 SMA (nearing oversold)
⦿ 52% → 51% above 150 SMA (bullish bias)
⦿ 63% → 63% above 200 SMA (bullish bias)
The Ratio between stocks above & below 50MA is 0.4, while that for 20MA is 0.35. The 10-day cumulative ratio for stocks above 50MA is 0.36. A value >2 is good for swing trades on the long side.
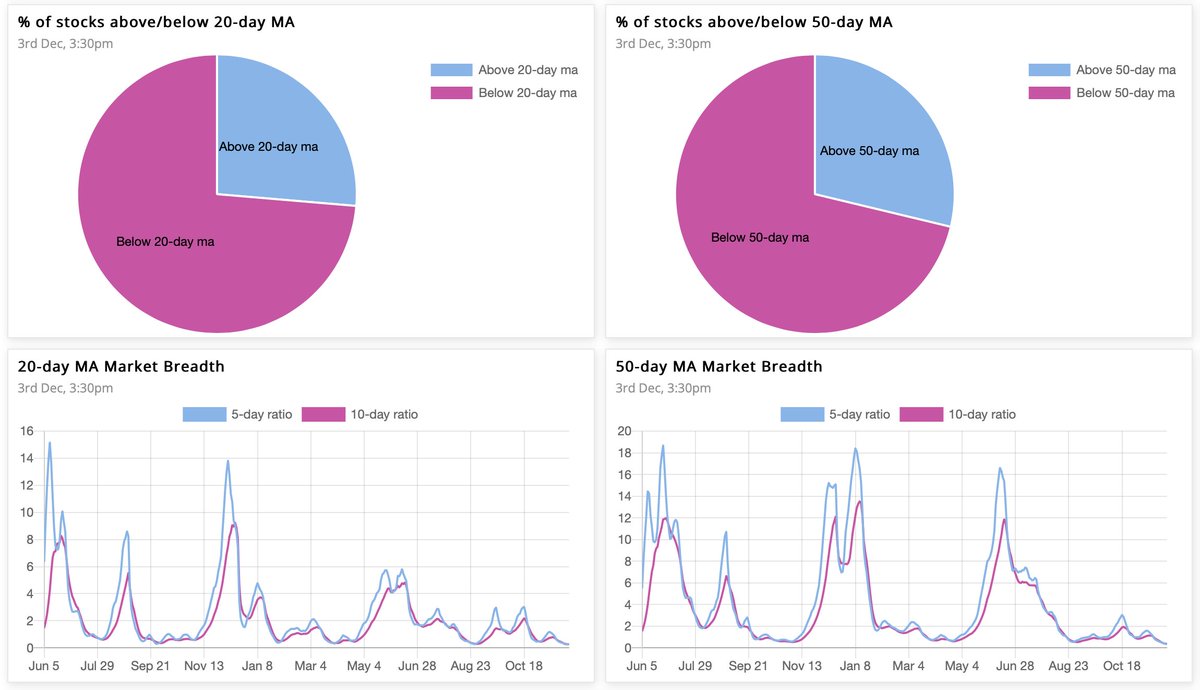
The number of stocks up 20% in past 5 days is coiling up & down like a spring, within a small range, still unable to get a proper bullish upthrust. For good swing trades, we need this number to shoot & stay up for a couple of days, as it did in the first half of October.

On a modified Stockbee market monitor, the 10-day cumulative ratio is 0.9 (from 0.8).
Number of stocks up 13% in 34 days is has been in the red for past 2 weeks, which shows that the market is in a short-term bearish phase.
Number of stocks up 13% in 34 days is has been in the red for past 2 weeks, which shows that the market is in a short-term bearish phase.
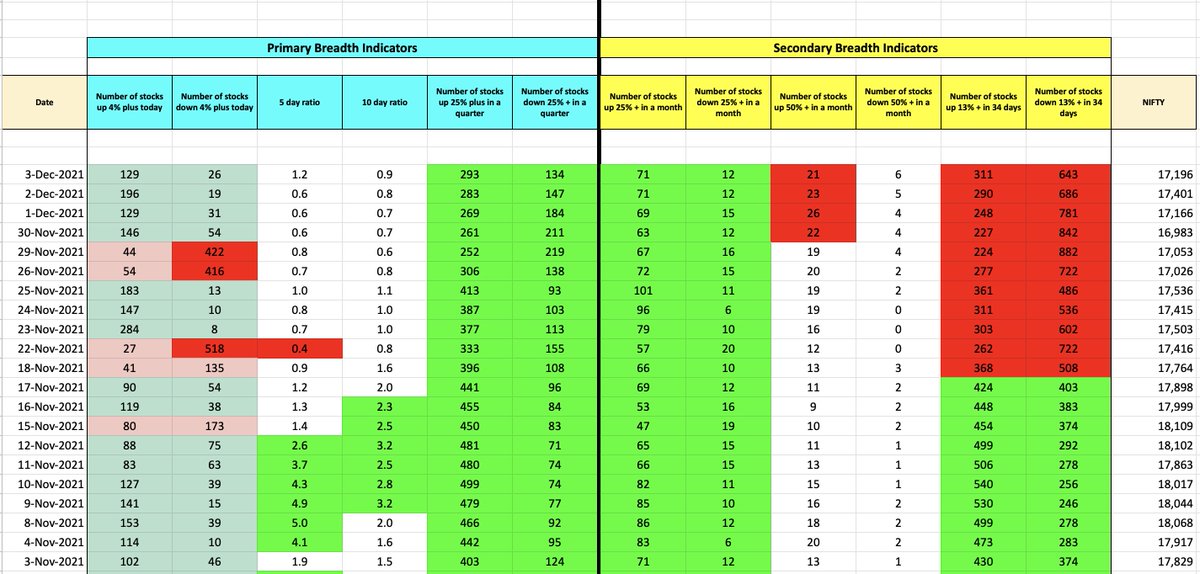
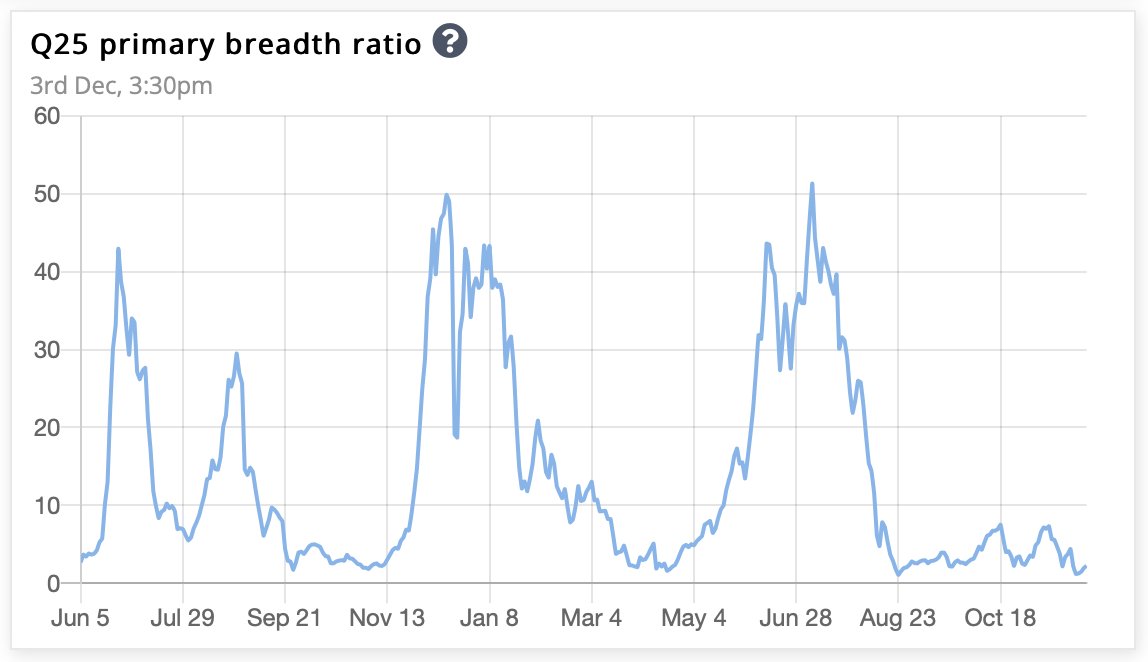
Overall, the market is bullish till the number of stocks up 25% plus in a quarter is more than those down 25% plus in a quarter. The ratio between the two is the primary breadth ratio, which is currently 2.19 (from 2.2), & has been in single digits since August 2021.
Loading suggestions...