

#WeeklyIndexCheck CW47/2021
Market status changed to Downtrend.
Momentum already lost in most major indices. At the end of this week, most of them are no longer in uptrend also.
Market breadth worsening, but nearing oversold.
Market status changed to Downtrend.
Momentum already lost in most major indices. At the end of this week, most of them are no longer in uptrend also.
Market breadth worsening, but nearing oversold.

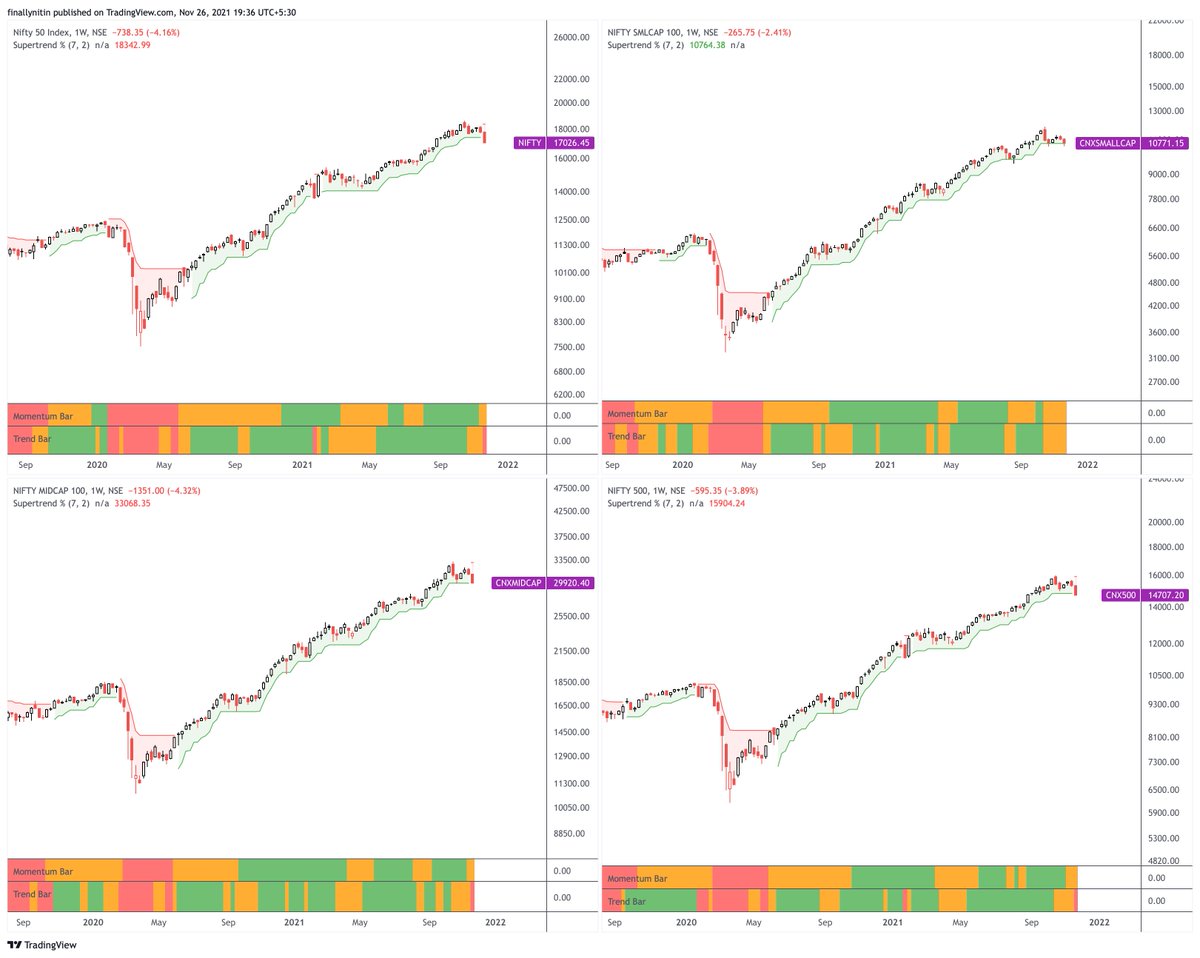
Nifty, Midcap100 & CNX500 are now in downtrend, while Smallcap 100 & Next-50 are still managing to be in the green.
Momentum lost in most major indices, except Realty, Energy, Power, Media, Auto & PSUbank.
Momentum lost in most major indices, except Realty, Energy, Power, Media, Auto & PSUbank.
Market breadth worsening on all timeframes. Nearing oversold levels on short-term charts.
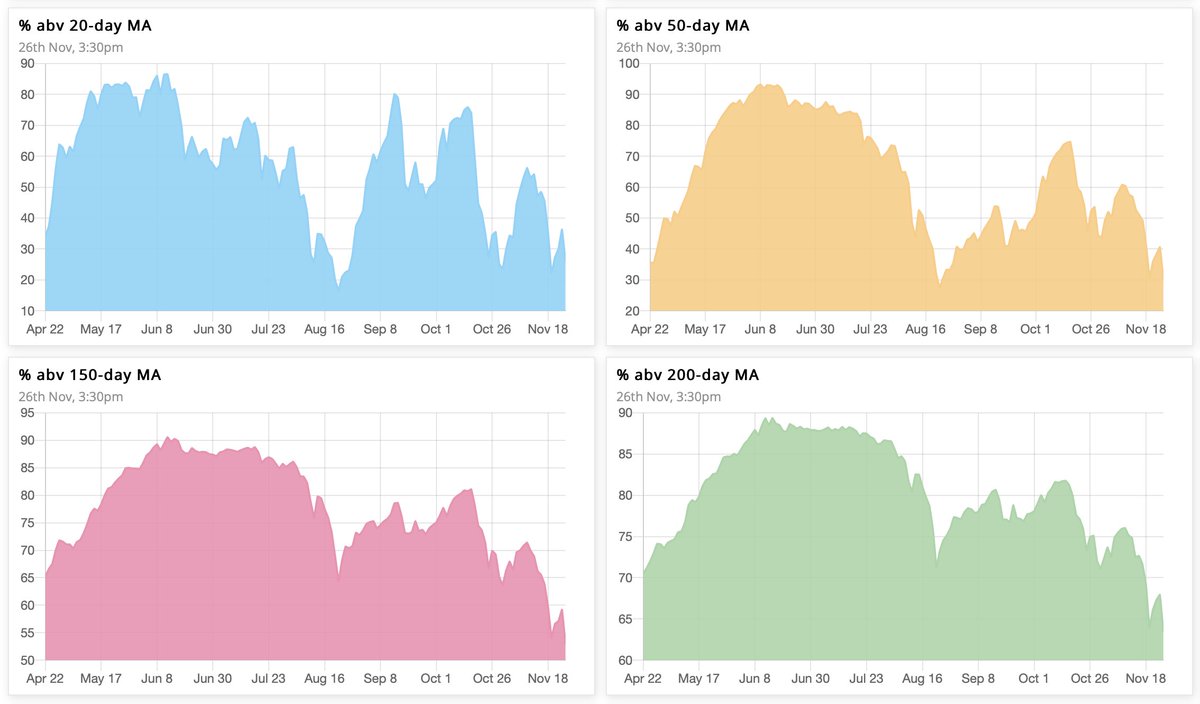
⦿ 35% → 25% above 20 SMA (nearing oversold)
⦿ 41% → 30% above 50 SMA (worsening)
⦿ 60% → 52% above 150 SMA (bullish bias)
⦿ 69% → 63% above 200 SMA (bullish bias)
⦿ 35% → 25% above 20 SMA (nearing oversold)
⦿ 41% → 30% above 50 SMA (worsening)
⦿ 60% → 52% above 150 SMA (bullish bias)
⦿ 69% → 63% above 200 SMA (bullish bias)
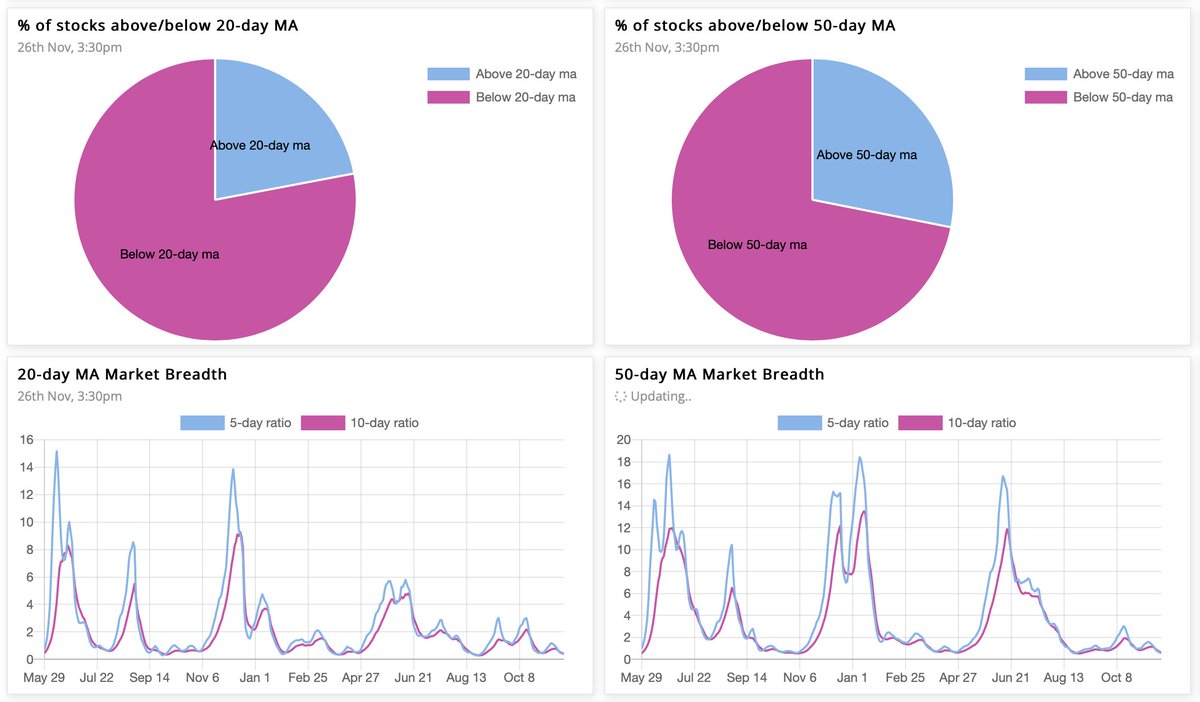
The Ratio between stocks above & below 50MA is 0.39, while that for 20MA is 0.28. The 10-day cumulative ratio for stocks above 50MA is 0.6. A value >2 is good for swing trades on the long side.
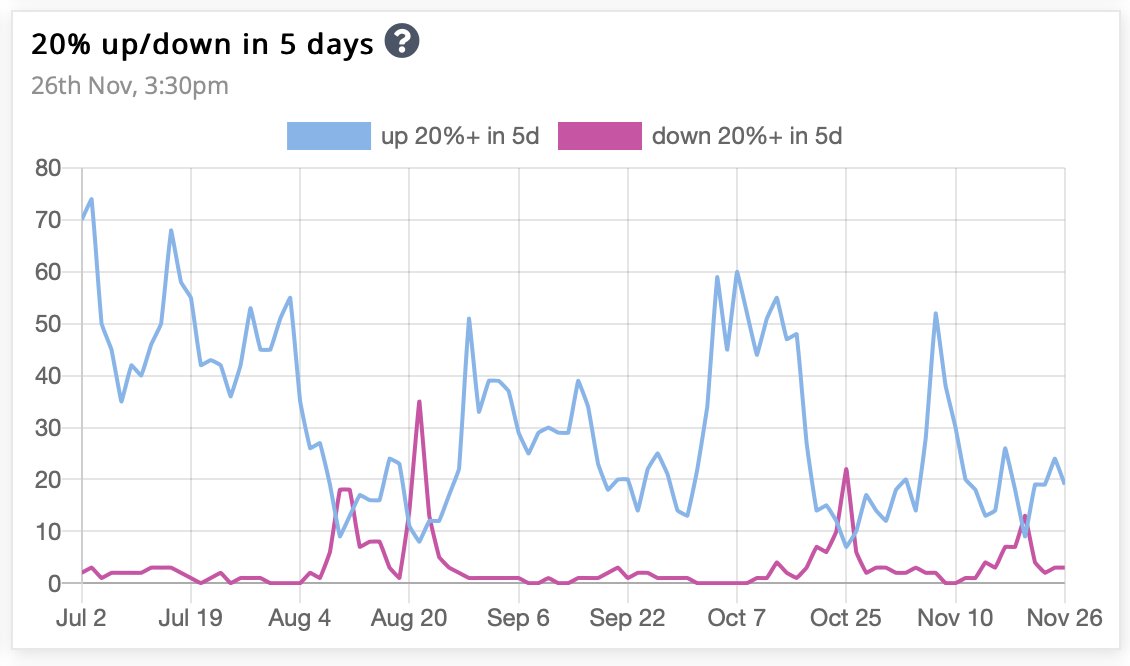
The number of stocks up 20% in past 5 days made yet another unsuccessful attempt at a bullish thrust, but ended up making yet another lower high. For good swing trades, we need this number to stay up for a couple of days, as it did in the first half of October.
On a modified Stockbee market monitor, the 10-day cumulative ratio is 0.8 (from 1.6). Number of stocks down 4% plus shows high selling pressure.
Number of stocks up 13% in 34 days is has been in the red all this week, which shows that the market is in a short-term bearish phase.
Number of stocks up 13% in 34 days is has been in the red all this week, which shows that the market is in a short-term bearish phase.
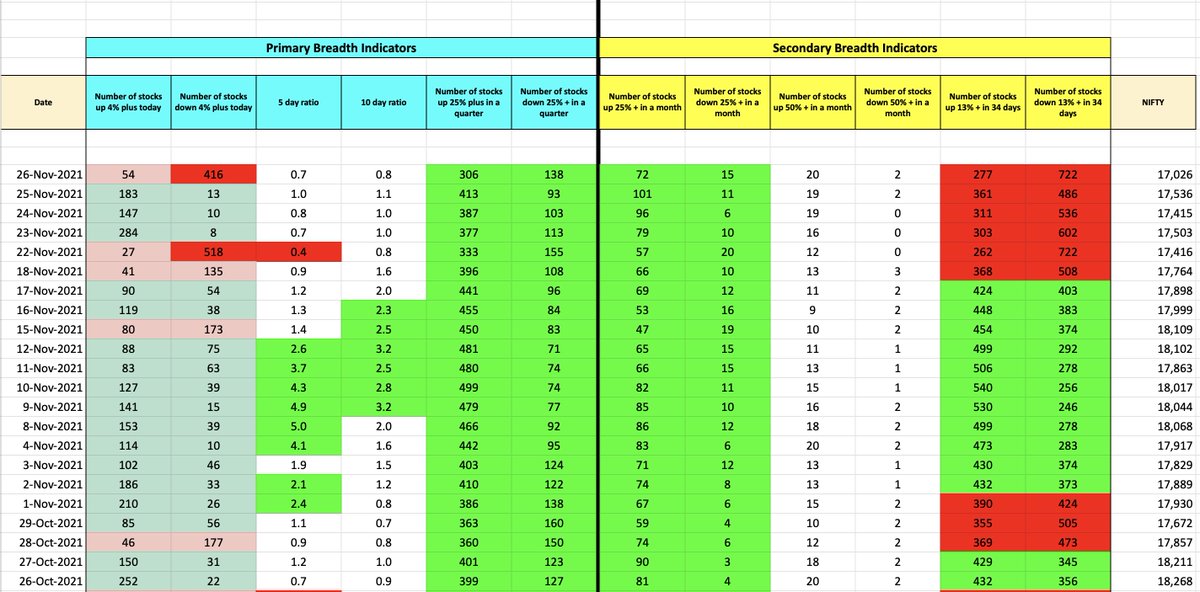
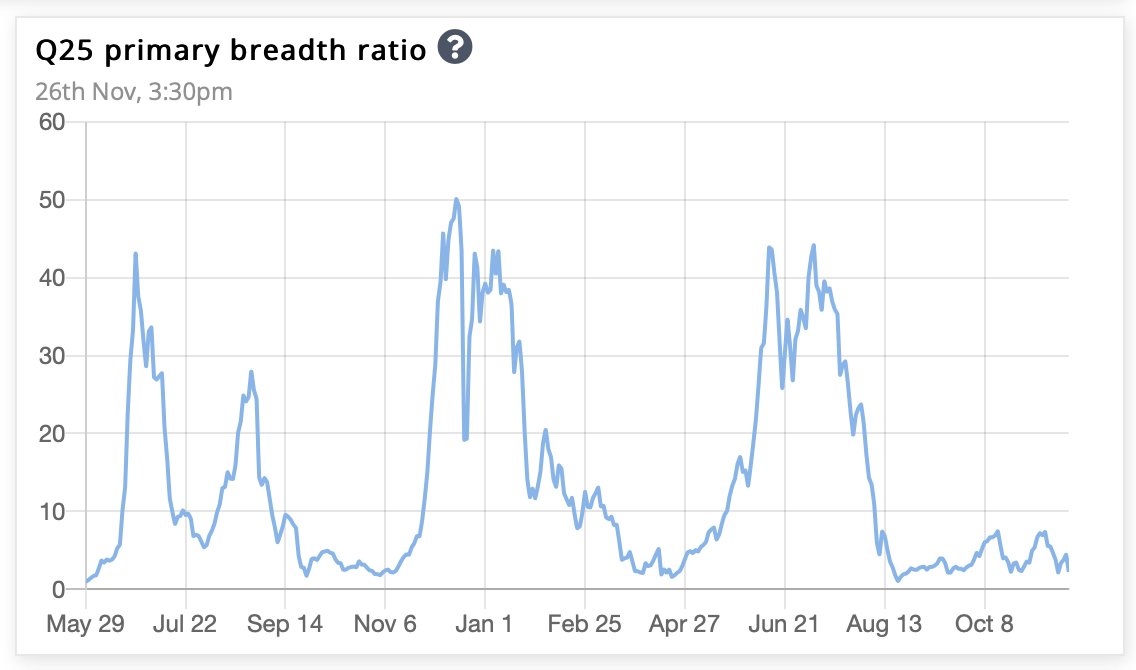
Overall, the market is bullish till the number of stocks up 25% plus in a quarter is more those down 25% plus in a quarter. The ratio between the two is the primary breadth ratio, which is currently 2.2 (from 3.6), & has unfortunately been in single digits since August 2021.
Loading suggestions...