

A beginner's guide to Technical Analysis (PART 4)📈📉
In the last part I taught how to trade using 'Support and Resistance', now I'll be teaching you another trading strategy which is using 'Trendlines'.
I'll make this as simple as possible for beginners.
A thread. #RETWEET 🔥
In the last part I taught how to trade using 'Support and Resistance', now I'll be teaching you another trading strategy which is using 'Trendlines'.
I'll make this as simple as possible for beginners.
A thread. #RETWEET 🔥
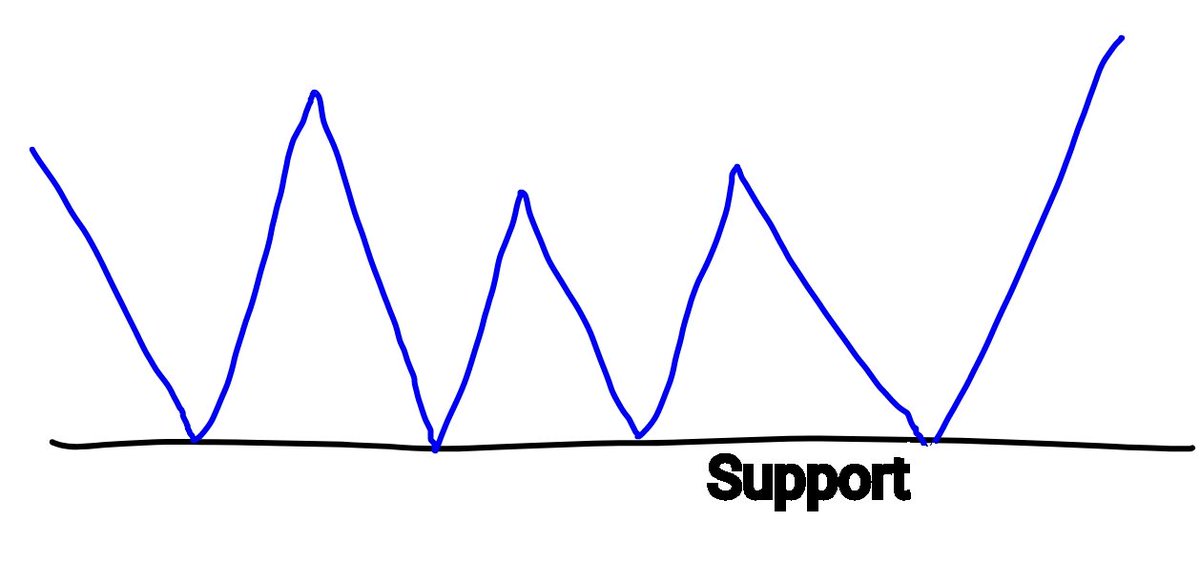
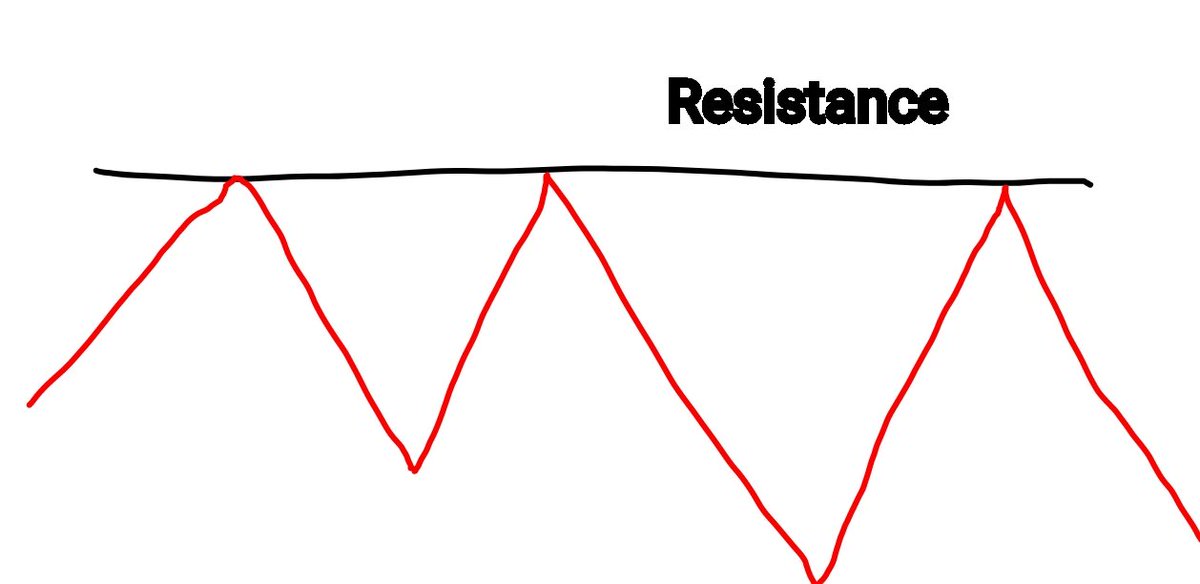
Remember in the last part, I told you about how price gets formed in key levels and how you can buy/LONG at support and sell/SHORT at resistance.
The Trendline strategy is similar to this, and the only difference between them is that while support and resistance are...
The Trendline strategy is similar to this, and the only difference between them is that while support and resistance are...
horizontal, Trendlines are vertical.
I've taught about market structure in the previous lectures where I listed market types:
- Trending markets
- Sideway/Ranging markets
While Support and Resistance works best in ranging market, Trendlines are more useful in trending markets.
I've taught about market structure in the previous lectures where I listed market types:
- Trending markets
- Sideway/Ranging markets
While Support and Resistance works best in ranging market, Trendlines are more useful in trending markets.
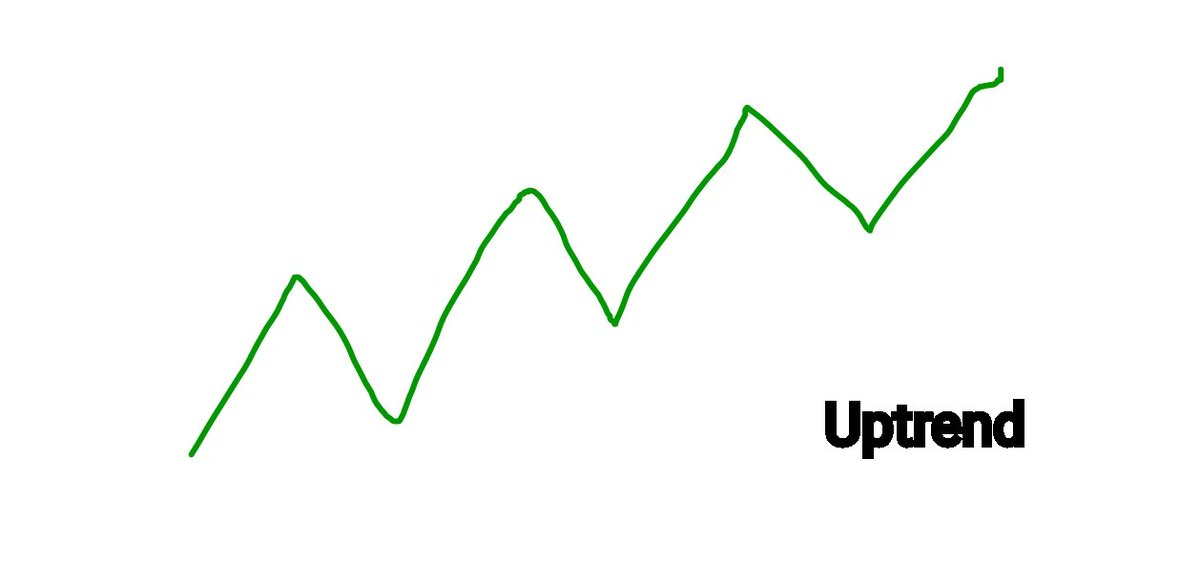

Now what is a Trendline?
A Trendline is simply a line that connects significant highs and lows of price in a trending market.
Trend = Market direction
Line = Pointer.
You get that simple explanation.
Remember Support & Resistance are Horizontal while Trendlines are Vertical.
A Trendline is simply a line that connects significant highs and lows of price in a trending market.
Trend = Market direction
Line = Pointer.
You get that simple explanation.
Remember Support & Resistance are Horizontal while Trendlines are Vertical.
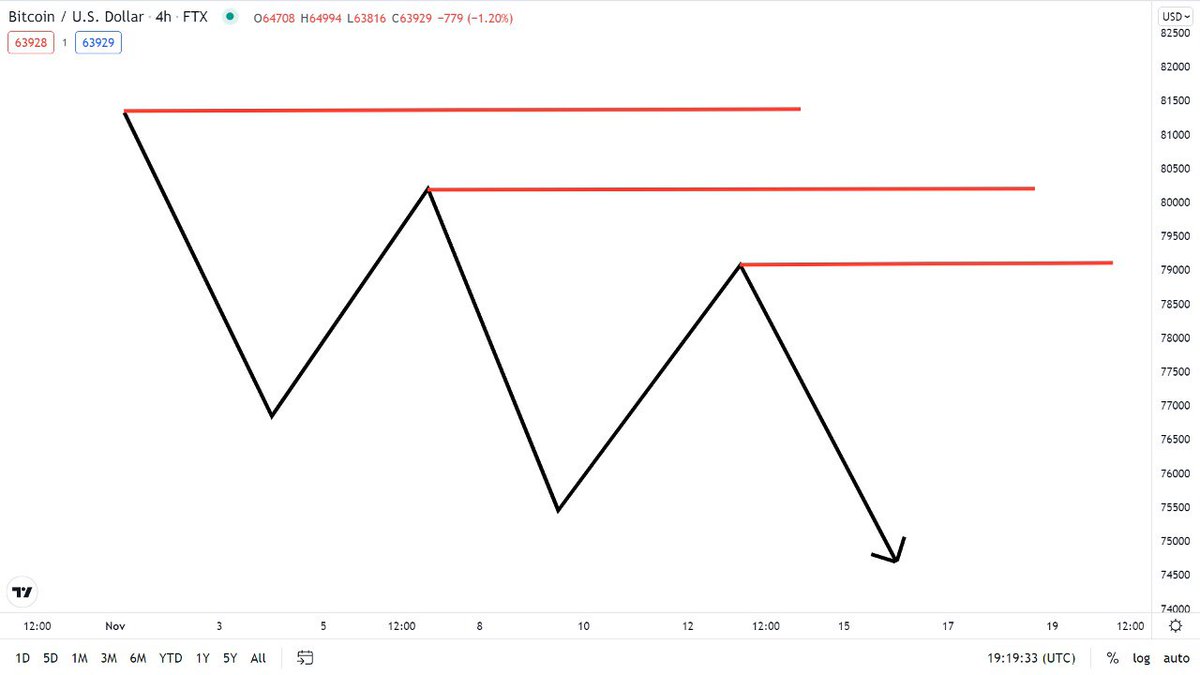
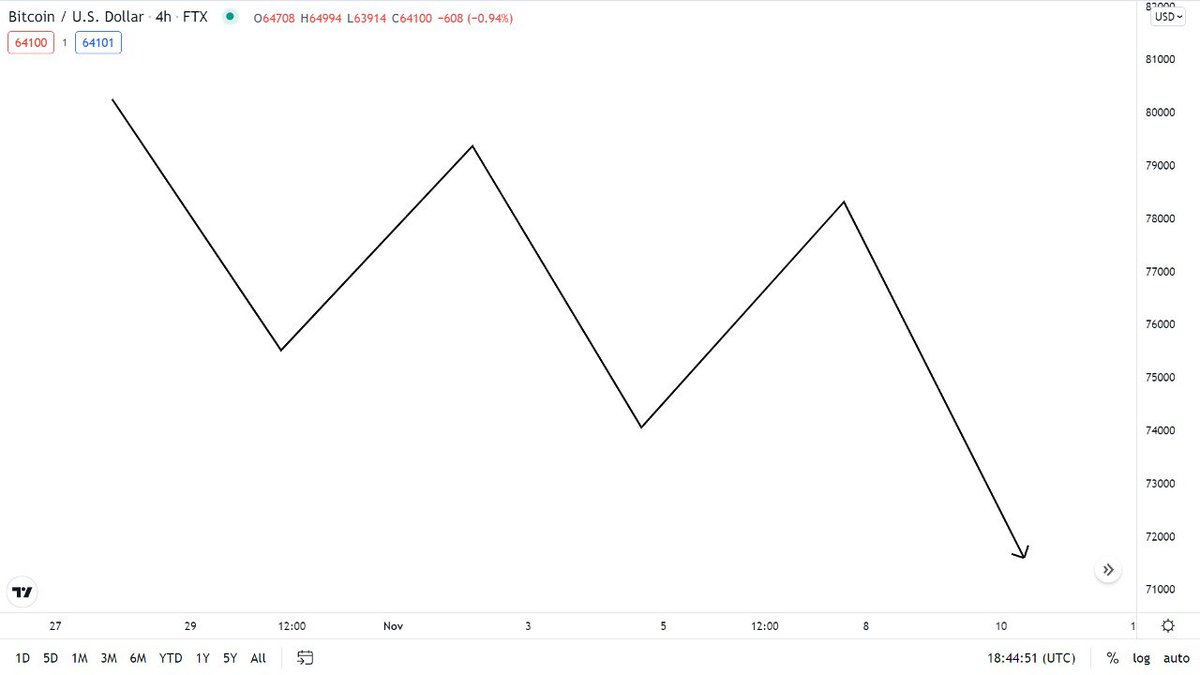
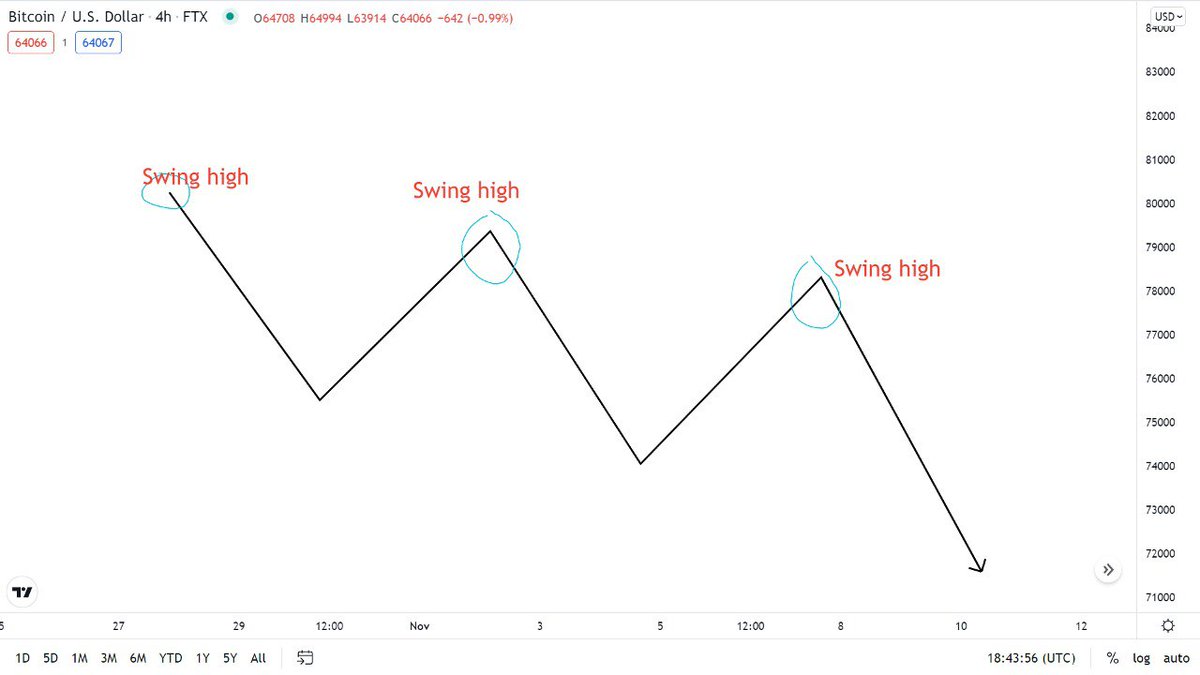
If we decide to use the Support and Resistance strategy in a Trending market as you can see in the frames below, it wouldn't make sense.
Why? There's no horizontal level where price has been rejected from TWICE.
So how do we trade in this scenario?
Why? There's no horizontal level where price has been rejected from TWICE.
So how do we trade in this scenario?
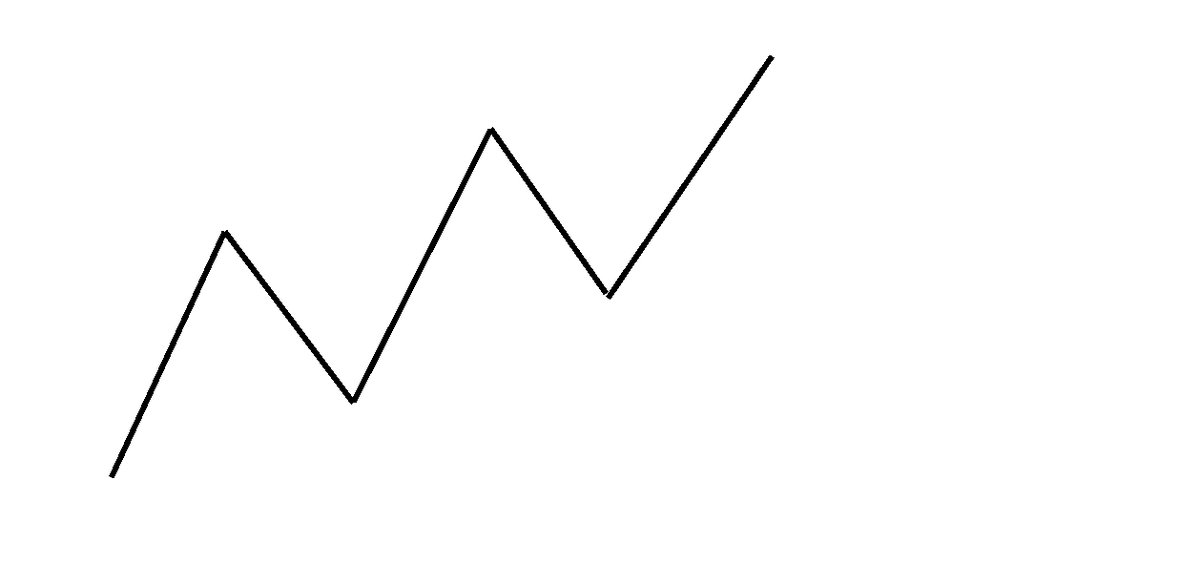

The Trendline strategy comes in here.
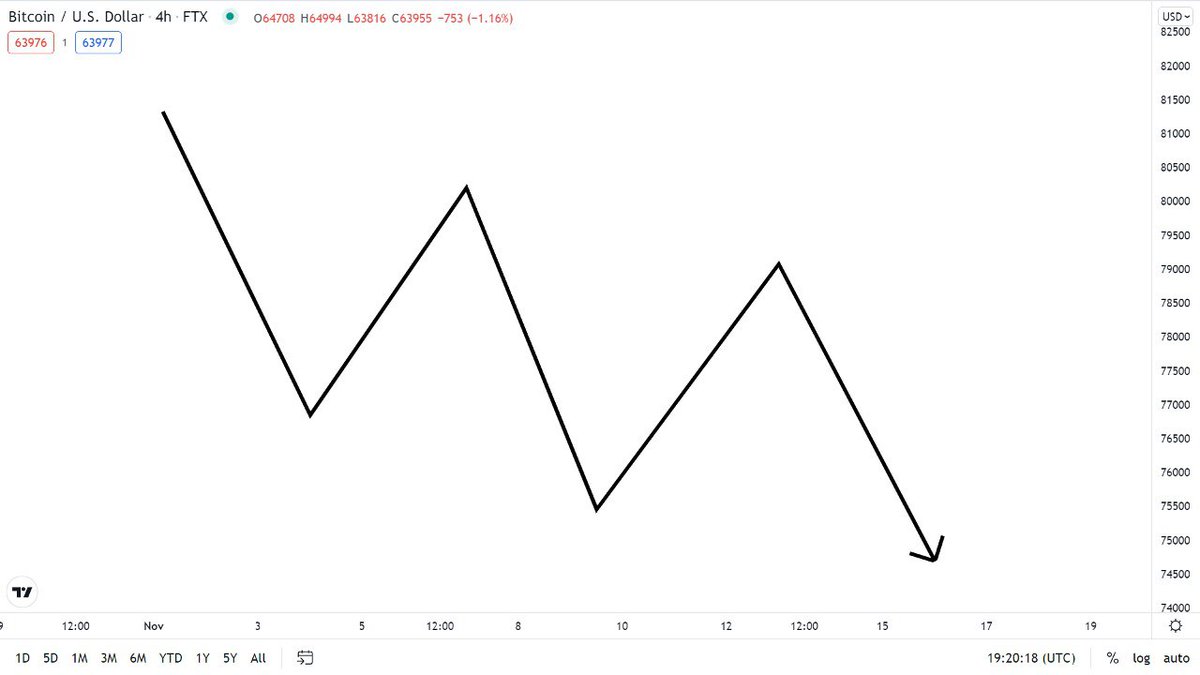
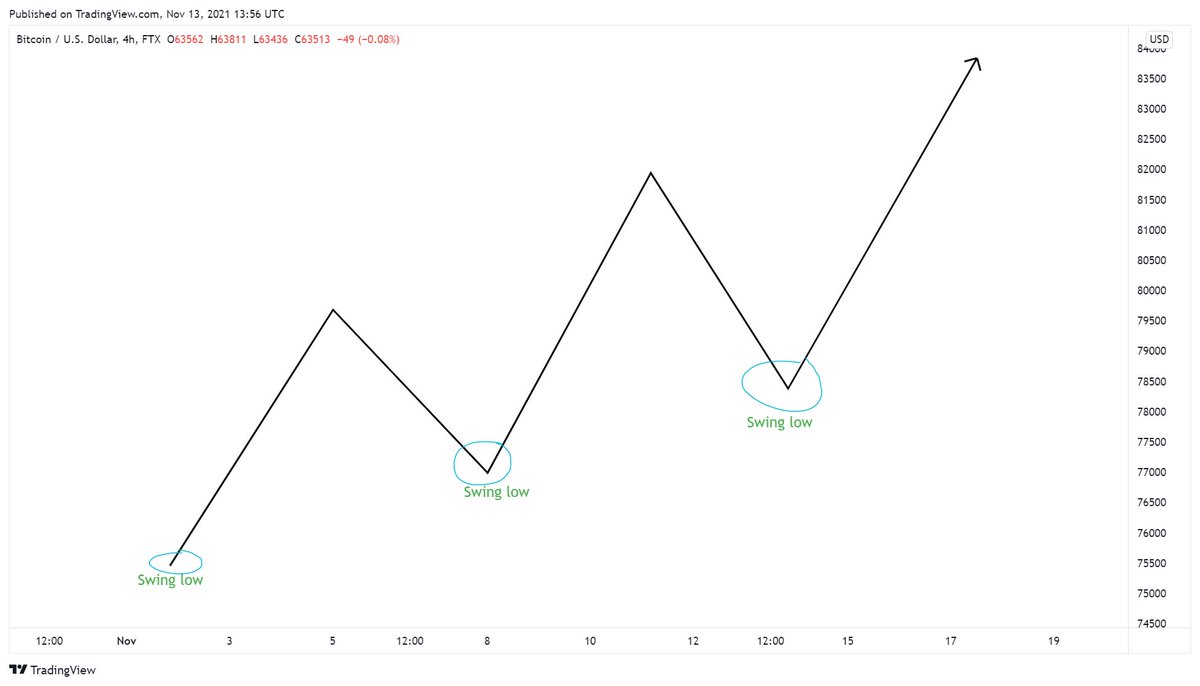
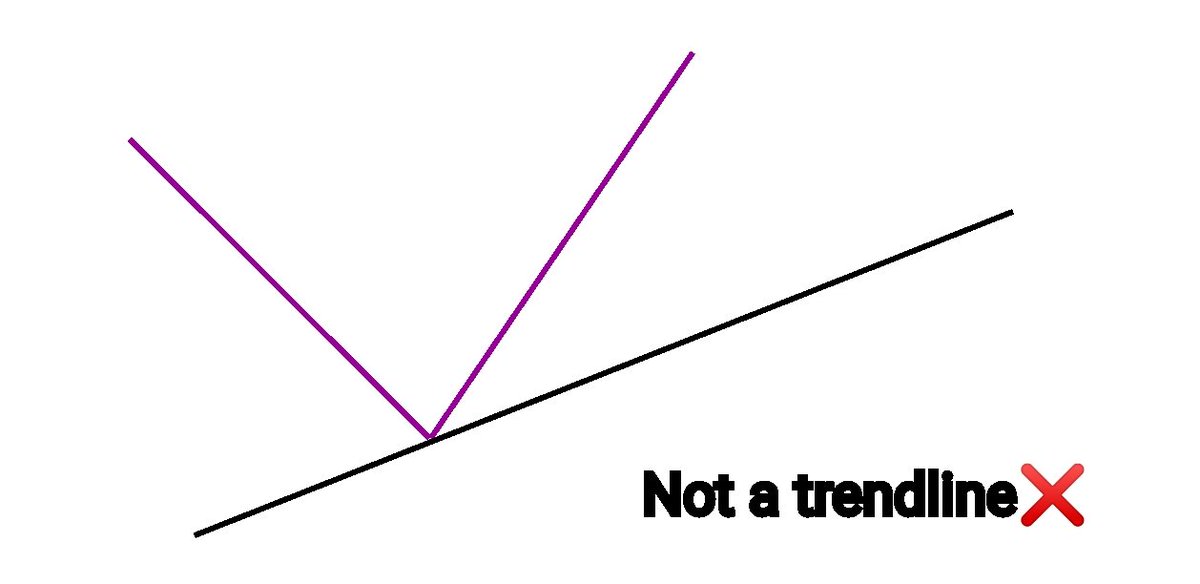
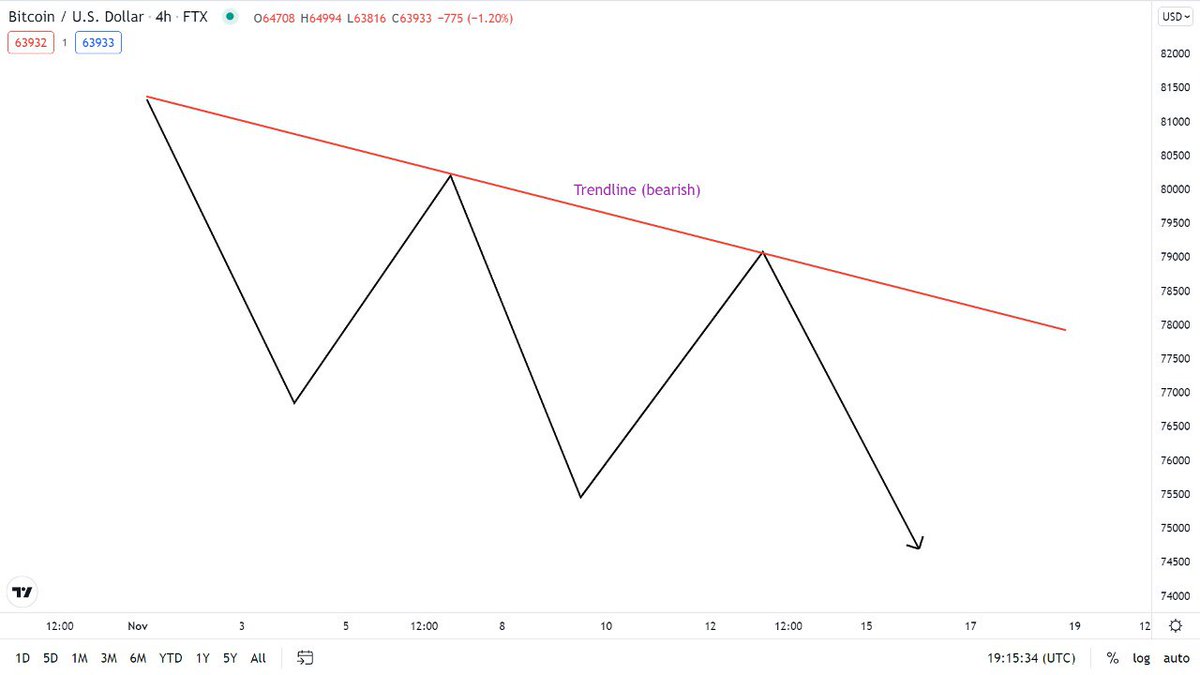
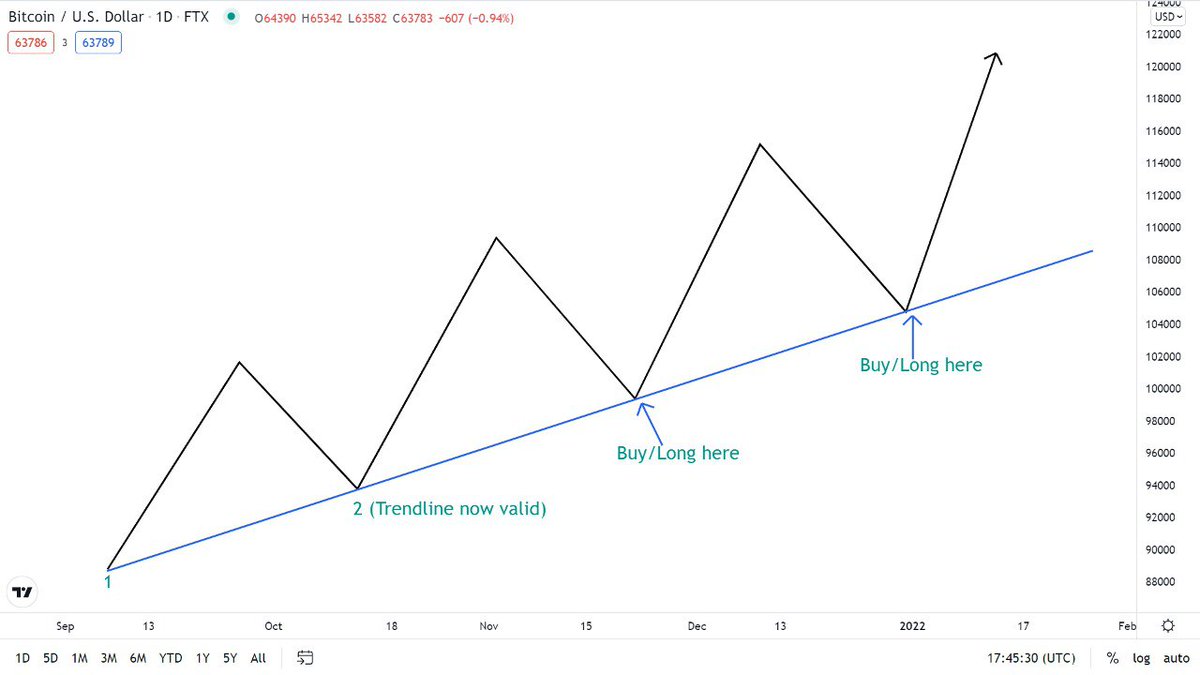
We use the Trendline by drawing a vertical line that connects AT LEAST TWO higher lows (swing lows) in an uptrend, or AT LEAST TWO lower highs (swing highs) in a downtrend.
I've circled the swing highs/lows so you can easily identify them.
We use the Trendline by drawing a vertical line that connects AT LEAST TWO higher lows (swing lows) in an uptrend, or AT LEAST TWO lower highs (swing highs) in a downtrend.
I've circled the swing highs/lows so you can easily identify them.
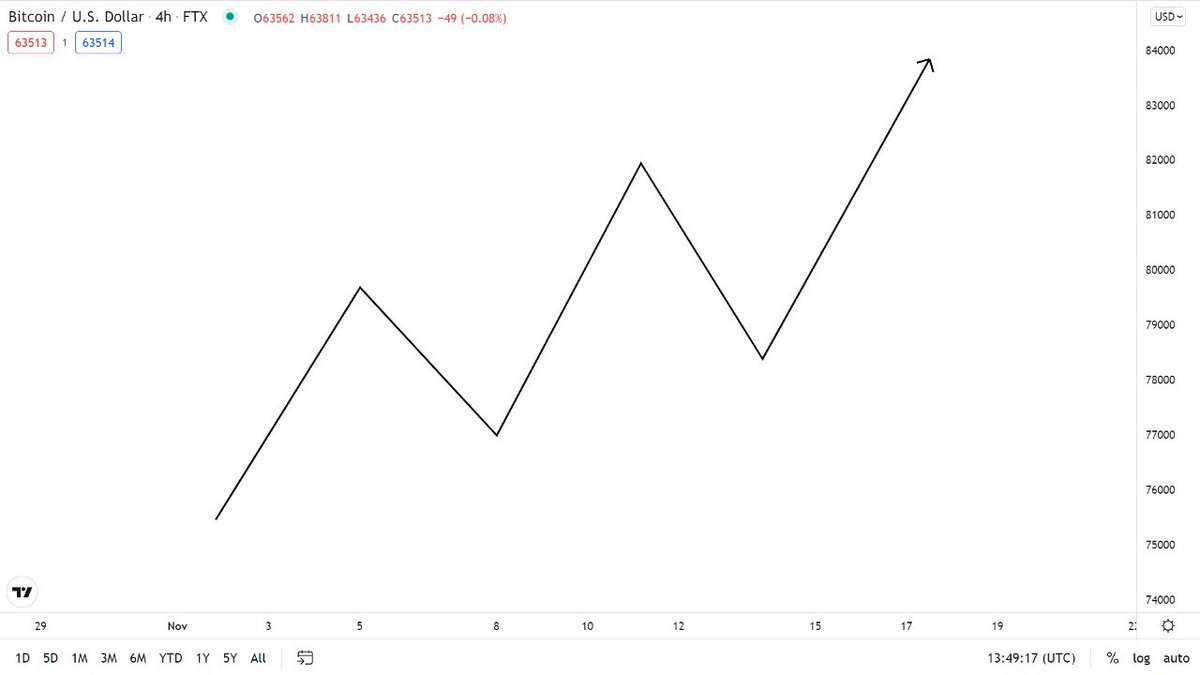
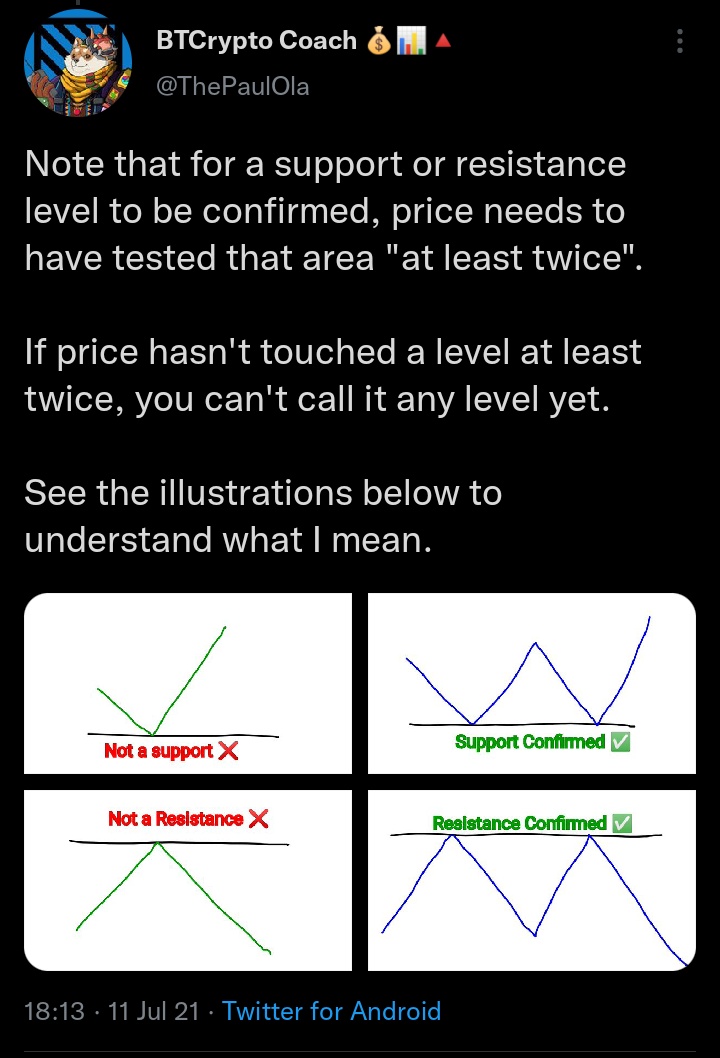
A trendline needs to have at least TWO vertical touches to be valid.
The rules of trendline trading is the same with support & resistance, they both need two areas of rejection to be valid.
Support & Resistance needs TWO HORIZONTAL TOUCHES, Trendlines need TWO VERTICAL TOUCHES.
The rules of trendline trading is the same with support & resistance, they both need two areas of rejection to be valid.
Support & Resistance needs TWO HORIZONTAL TOUCHES, Trendlines need TWO VERTICAL TOUCHES.
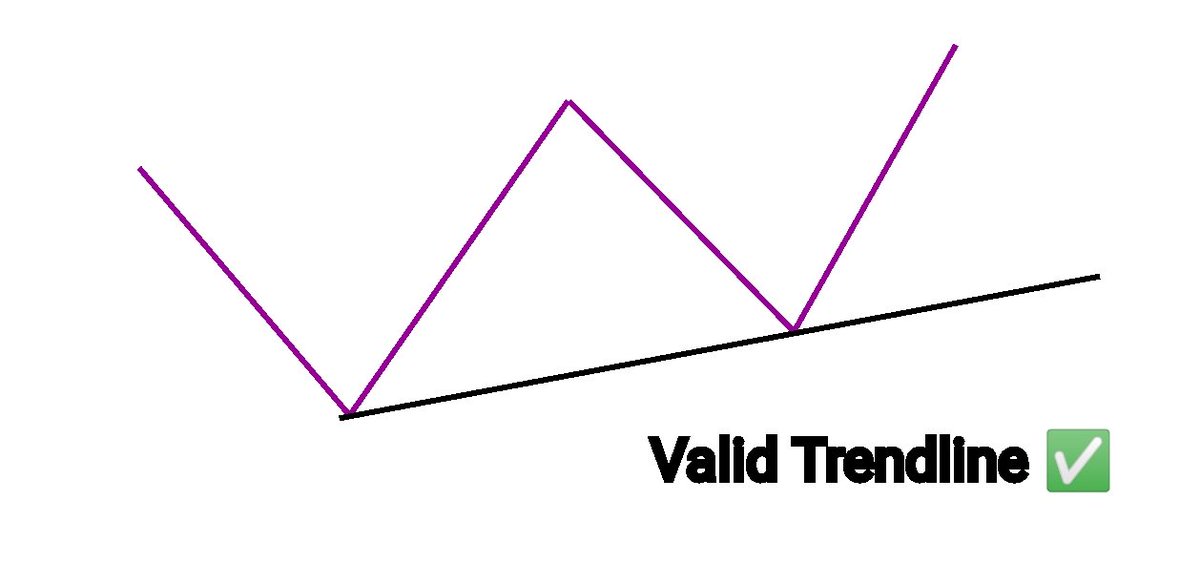
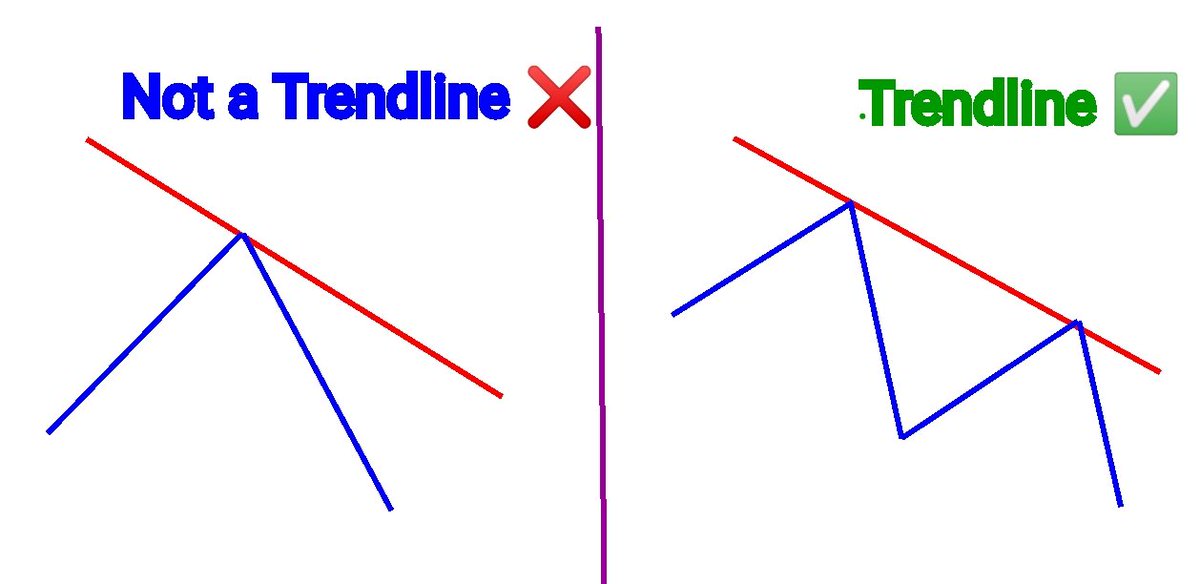
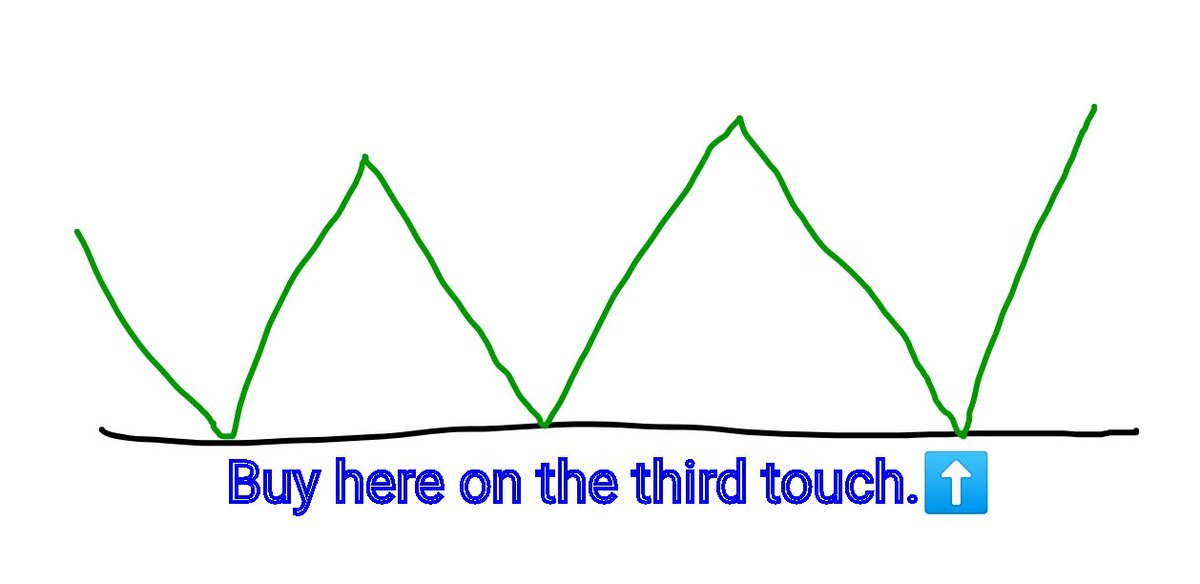
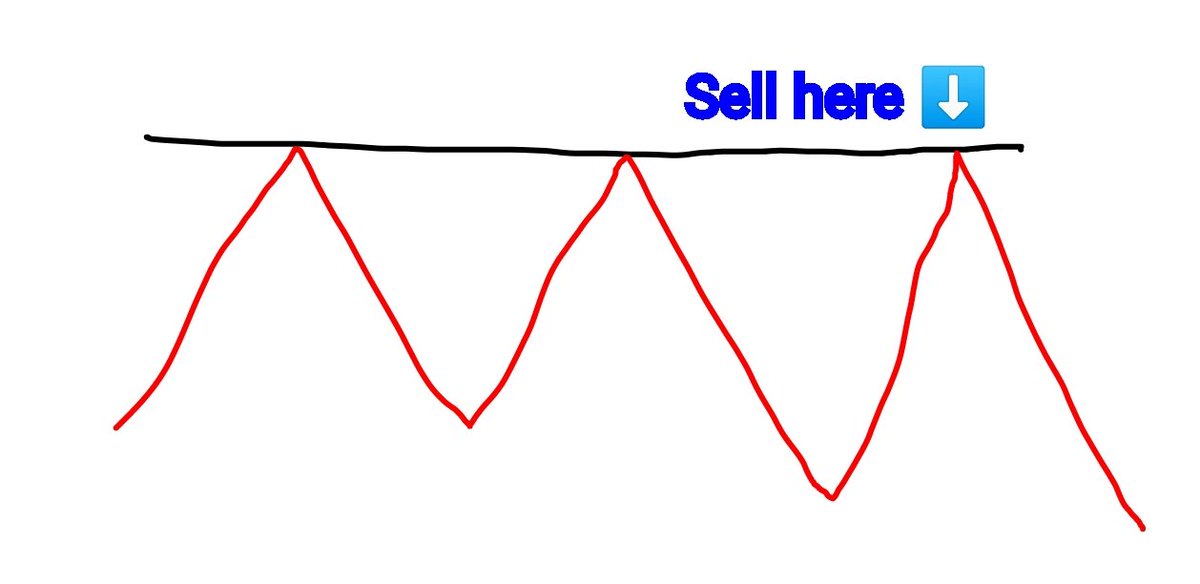
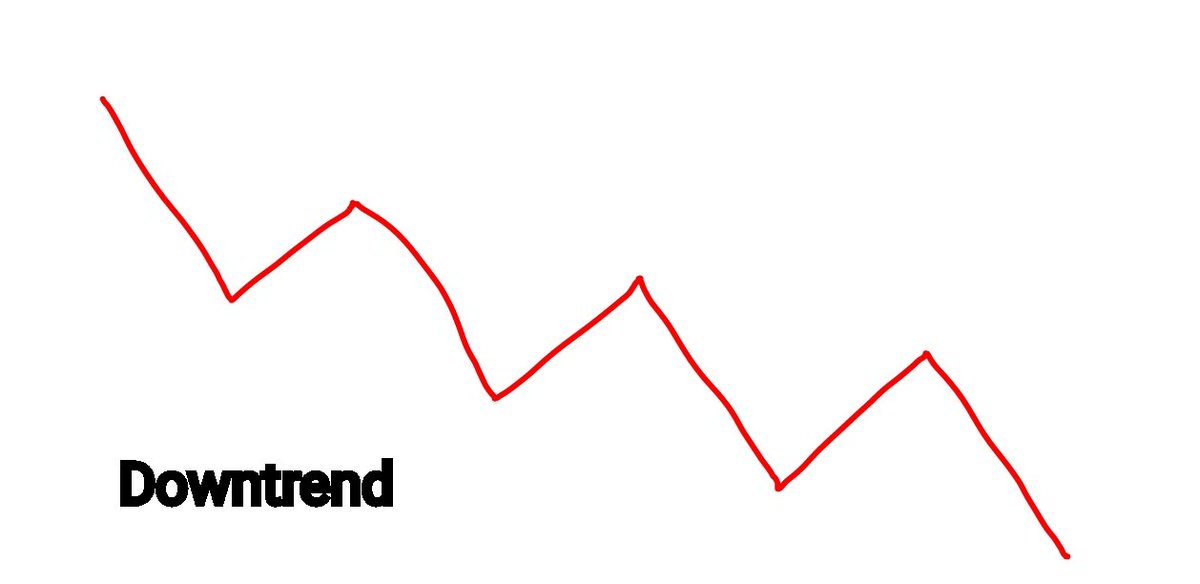
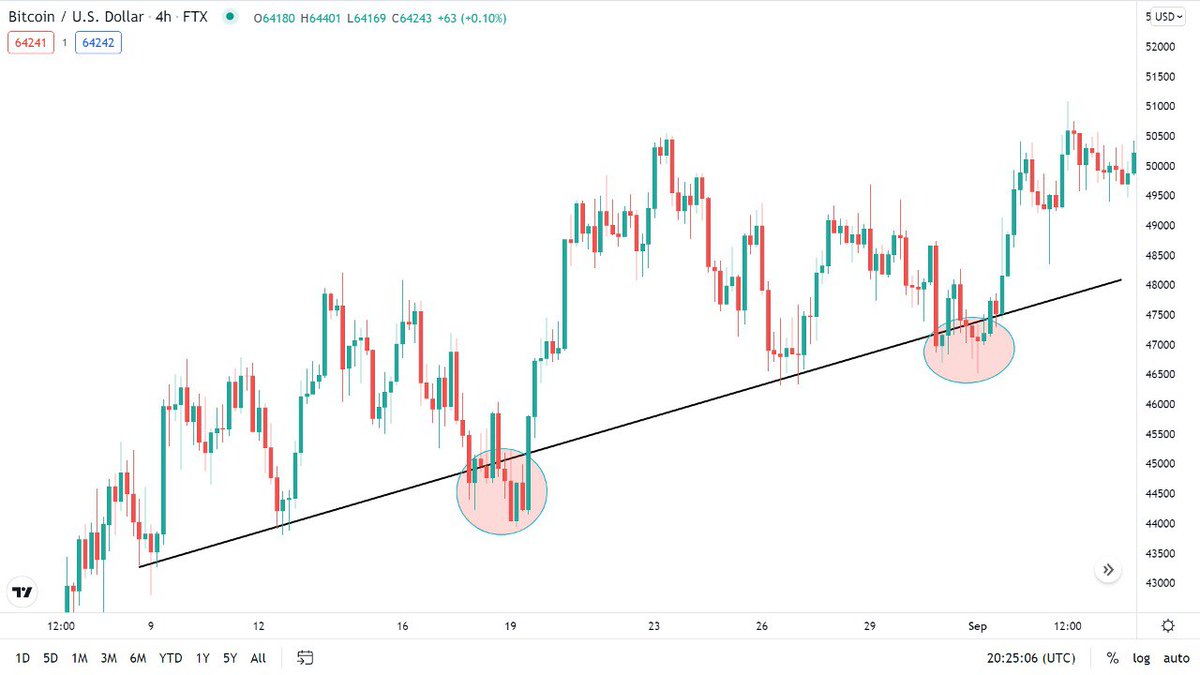
I've connected the higher lows with a green Trendline and the lower highs with red.
Now we can see how price reverses each time it touches the Trendline
NOTE:
A bullish trendline Supports price to go higher📈 while a bearish Trendline acts as Resistance for price to go lower.📉
Now we can see how price reverses each time it touches the Trendline
NOTE:
A bullish trendline Supports price to go higher📈 while a bearish Trendline acts as Resistance for price to go lower.📉
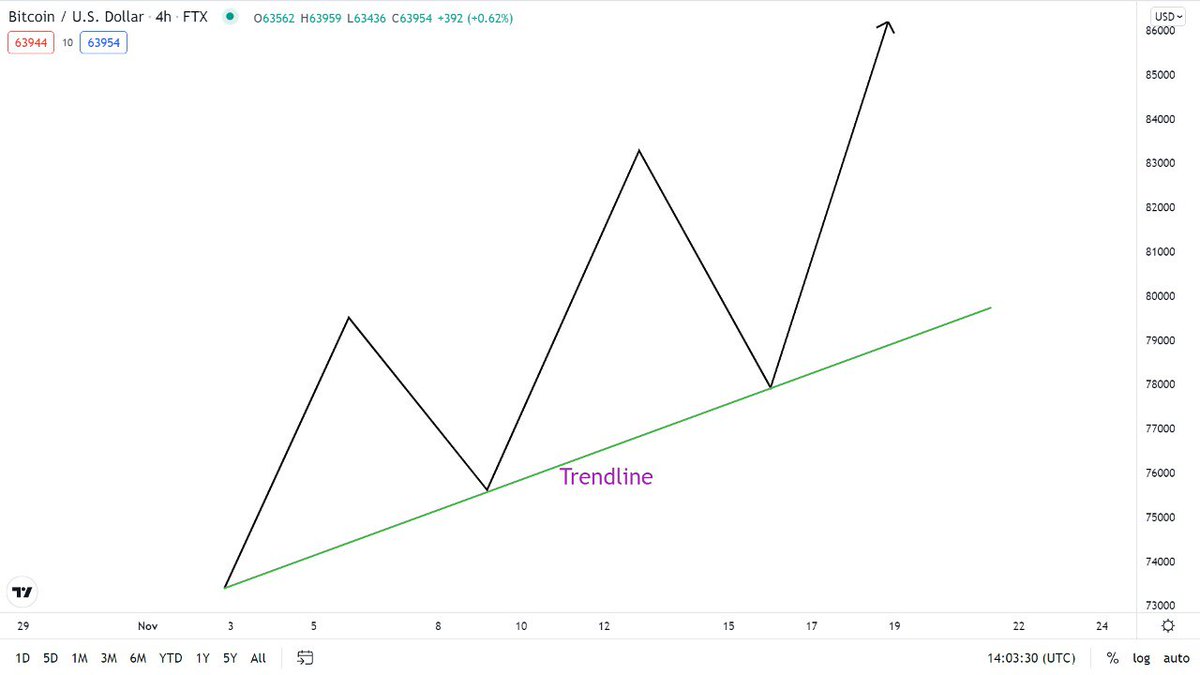
Now you expect price to make another bounce the next time it touches that line.
Let's go practical.
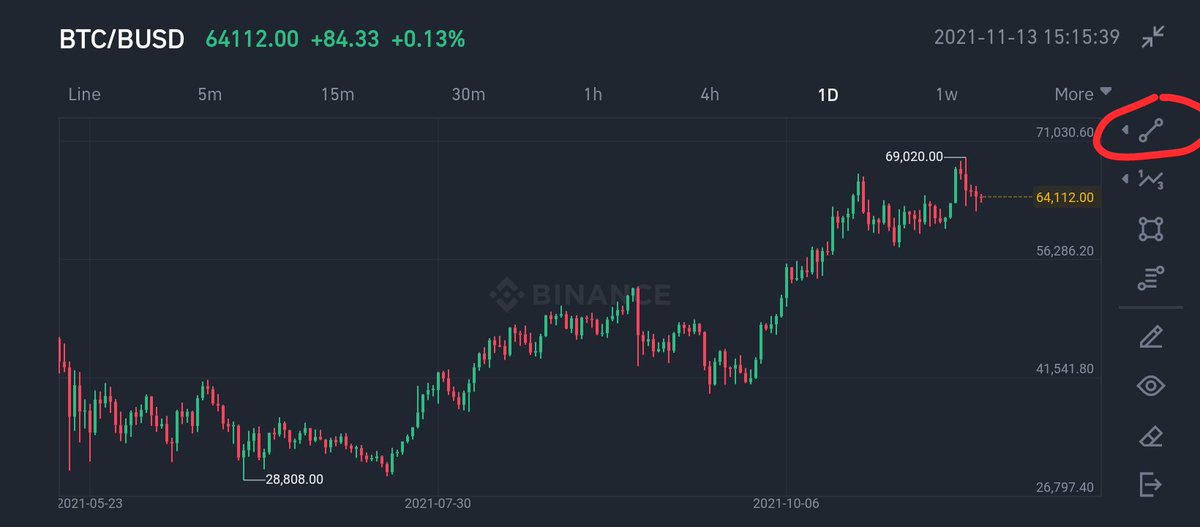
Open your Binance app and choose $BTC/BUSD right on the homepage (disable indicators).
Change to the chart layout and landscape mode & follow the directions in the images below.
Let's go practical.
Open your Binance app and choose $BTC/BUSD right on the homepage (disable indicators).
Change to the chart layout and landscape mode & follow the directions in the images below.
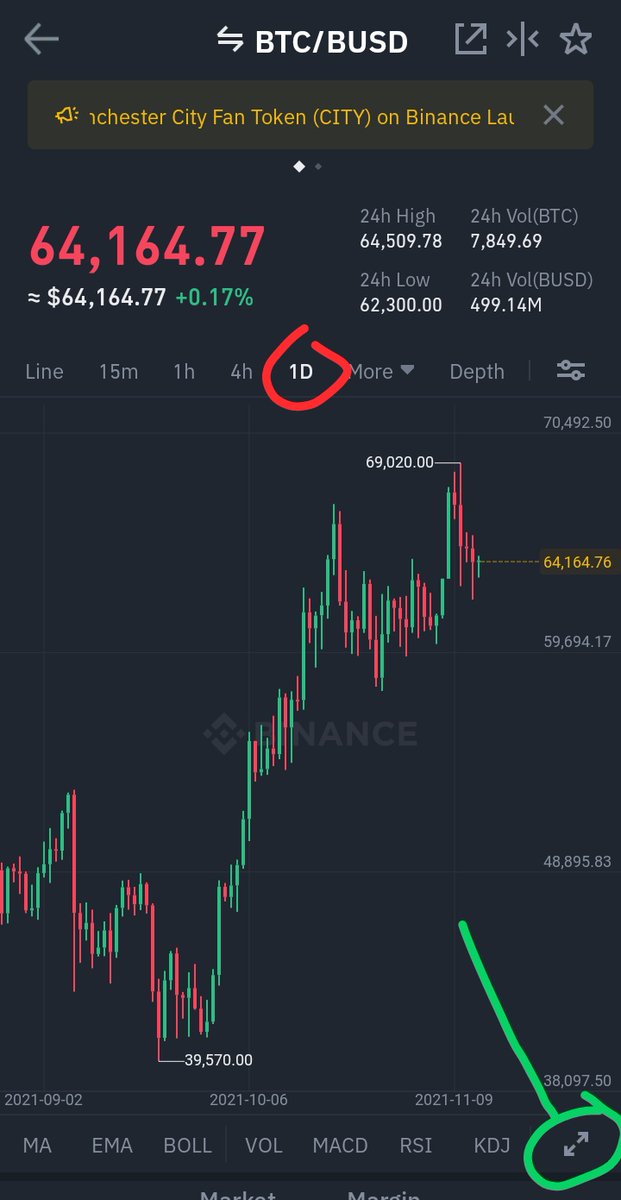
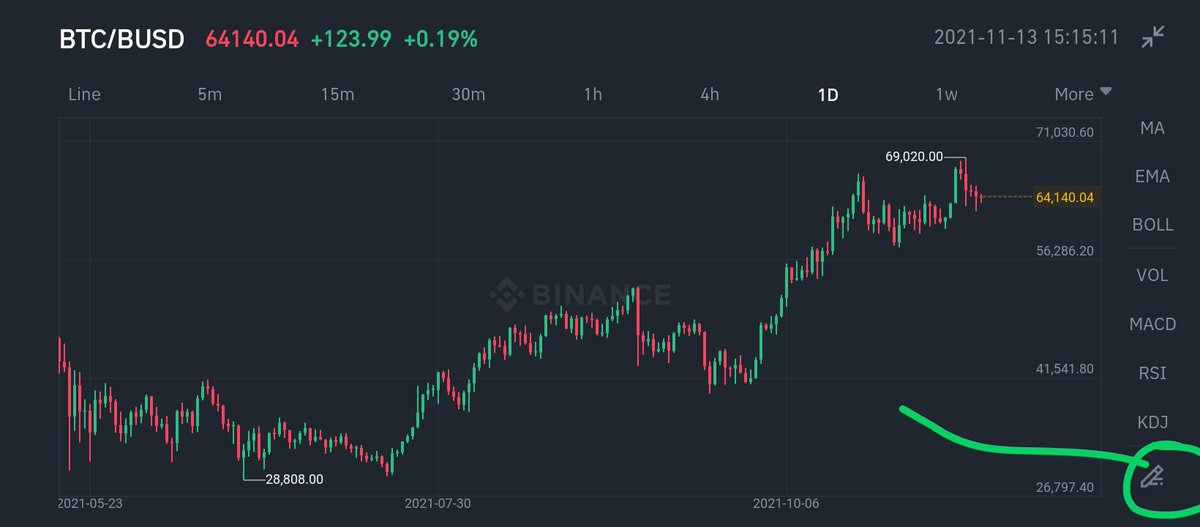

Once your chart is set, tap the lowest low in the range to the highest low just as shown in the video below.
We're trying to make our chart as clean as possible so we won't be drawing trendlines on every higher low, we'll be using only the Mid-July to Nov.
We're trying to make our chart as clean as possible so we won't be drawing trendlines on every higher low, we'll be using only the Mid-July to Nov.

In case you're not comfortable with using the Binance application, download the Trading View application on your device, it's a recommended application for technical analysis.
Watch the video below to see how to plot a Trendline using Trading View.
Watch the video below to see how to plot a Trendline using Trading View.

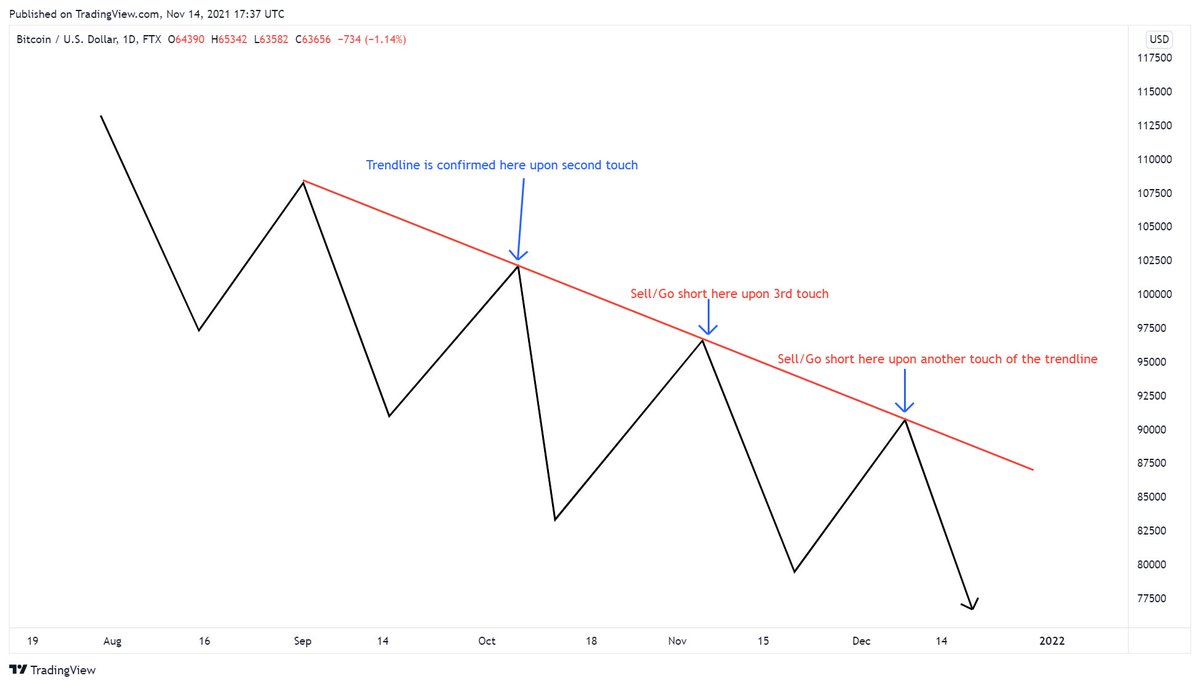
Now for drawing bearish trendlines you simply connect the lower highs or just invert what was shown in the video above.
NOTE: You can only draw a bullish trendline in an UPTREND and a bearish trendline in a DOWNTREND.
Watch the video below to see how to draw bearish trendlines.
NOTE: You can only draw a bullish trendline in an UPTREND and a bearish trendline in a DOWNTREND.
Watch the video below to see how to draw bearish trendlines.

We've been in a bull market for a long period now so you'll find more of Uptrends than downtrends.
Watch how to draw a bearish Trendline using Trading View.
It's actually much more comfortable analyzing technically with Trading View compared to any other app.
Watch how to draw a bearish Trendline using Trading View.
It's actually much more comfortable analyzing technically with Trading View compared to any other app.

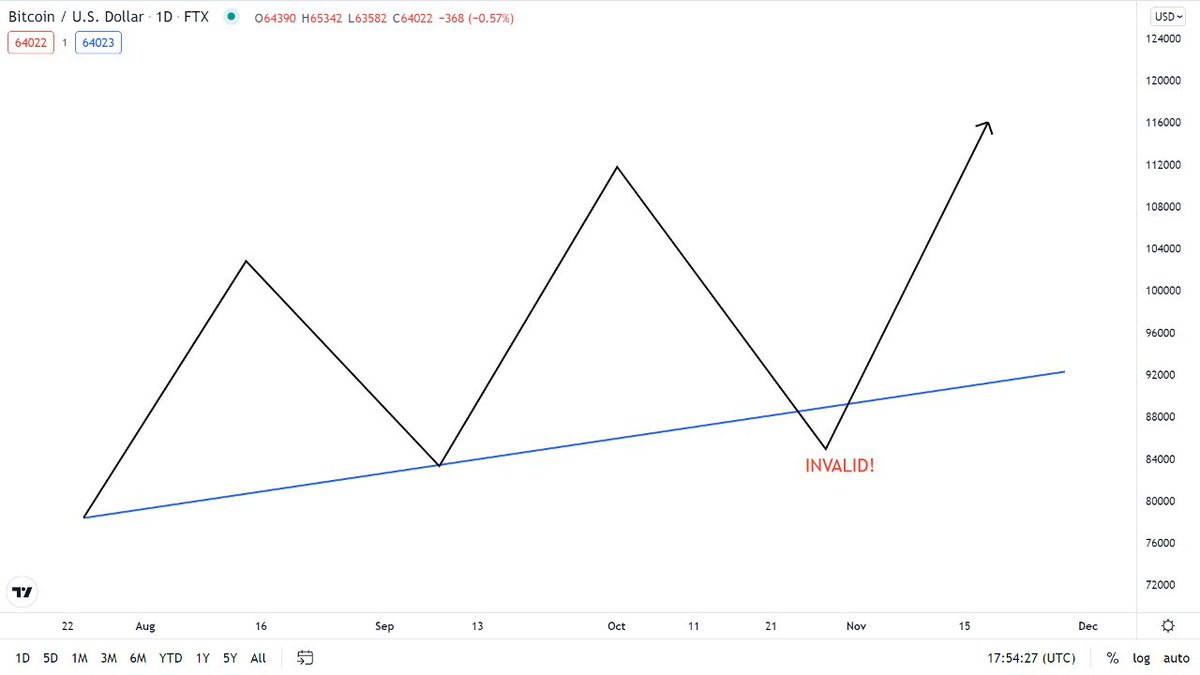
Now after drawing your Trendline and confirming it's validity, you expect a movement of price to the area so you can take a decision.
That is if it's a bullish trendline, you're looking to Buy/Long upon price touching the trendline, or Sell/Short if it's a bearish trendline.
That is if it's a bullish trendline, you're looking to Buy/Long upon price touching the trendline, or Sell/Short if it's a bearish trendline.
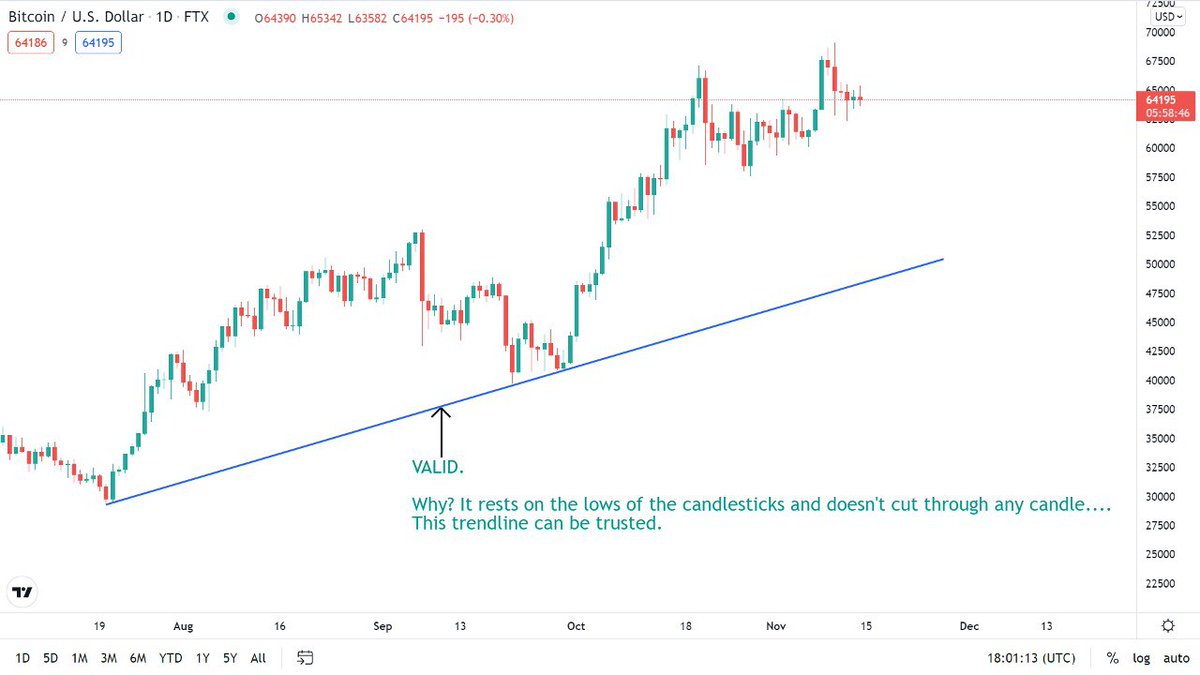
A rule of trendline trading is that you don't connect the lines through the bodies of the candles.
That is your trendline must not pass through the body of a candle, it must either rest on the wicks or at most rest ON the body (not through)
I'll show you this practically.
That is your trendline must not pass through the body of a candle, it must either rest on the wicks or at most rest ON the body (not through)
I'll show you this practically.
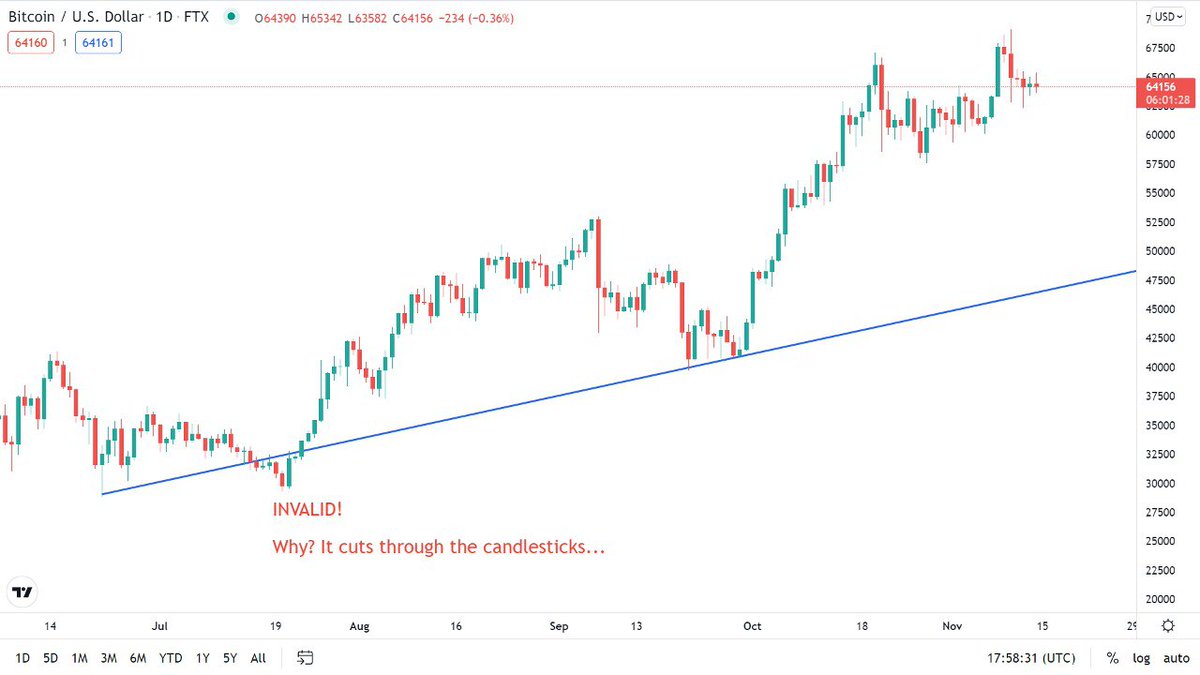
If your trendline isn't valid, you won't trust your trade because it's not justified, and if you play "too smart" and try to cut corners, you'll pay for it.
Trading humbles everyone, so it's better you're true to yourself and disciplined.
You can't outsmart the market. 👉😏
Trading humbles everyone, so it's better you're true to yourself and disciplined.
You can't outsmart the market. 👉😏
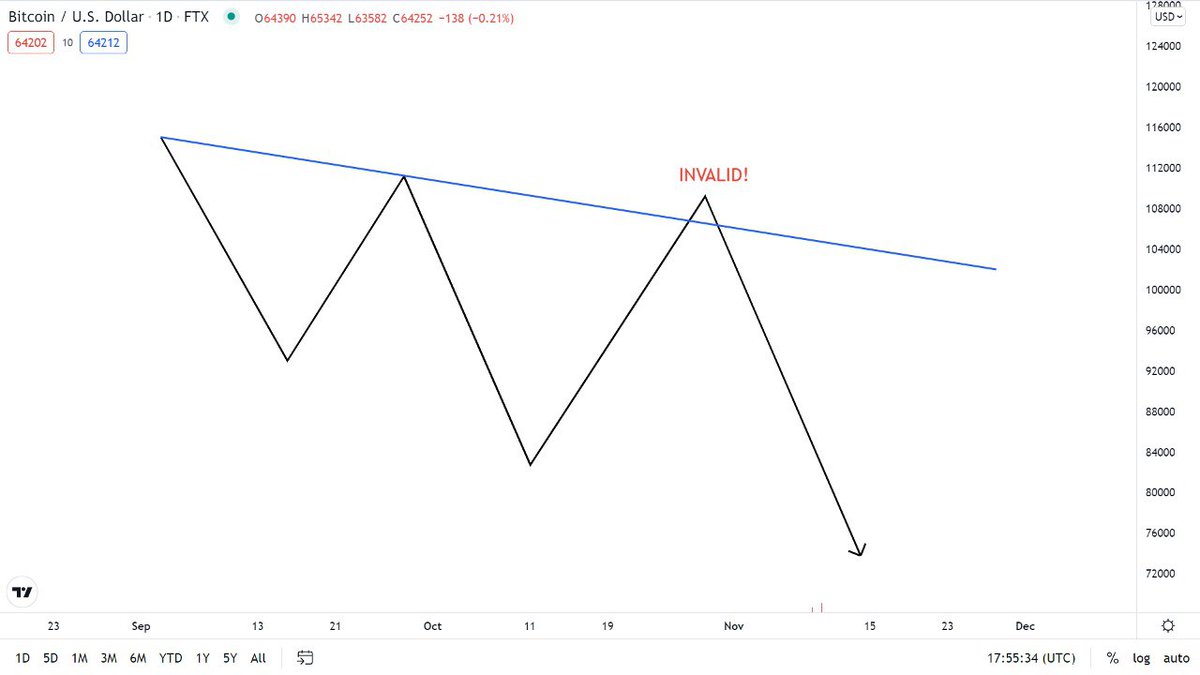
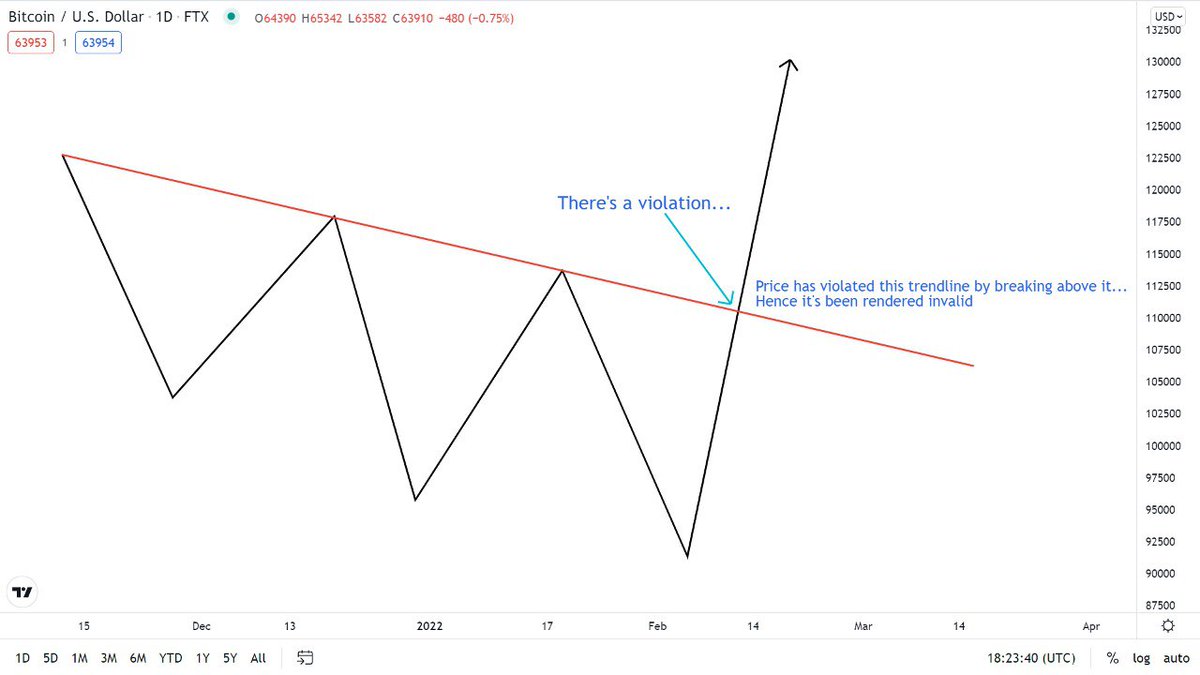
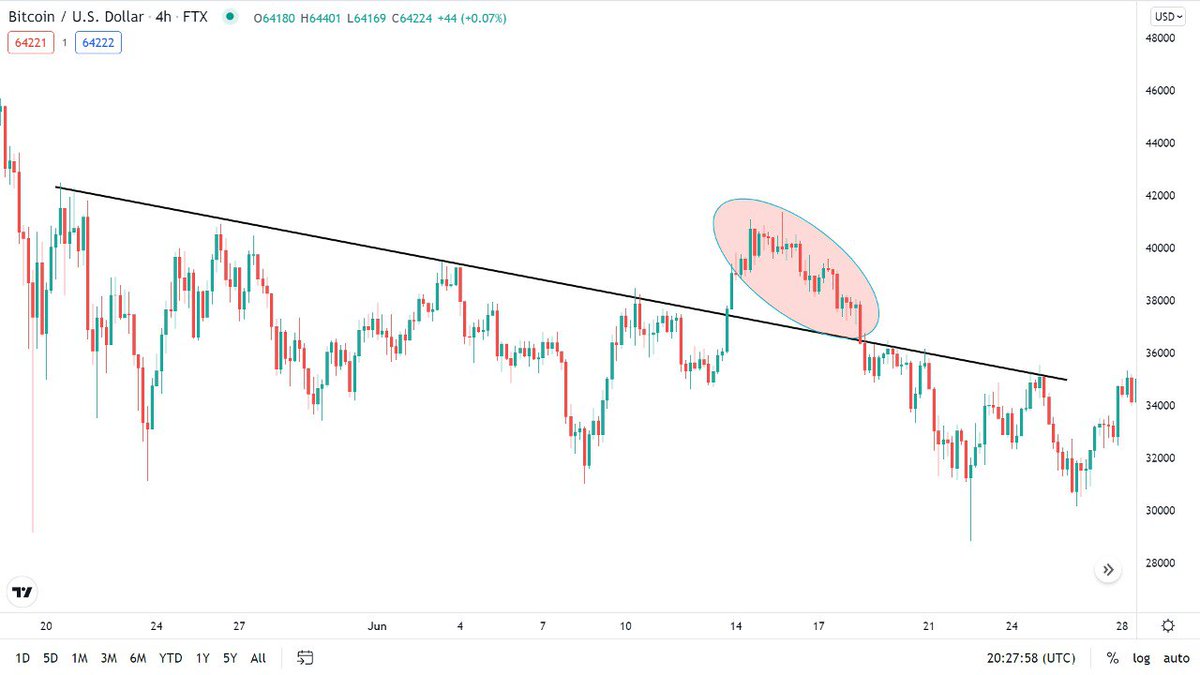
Also note that there are breakouts in trendline trading, that is an instance where price violates the trendline and changes direction opposite to the trend.
See the images to understand.
See the images to understand.
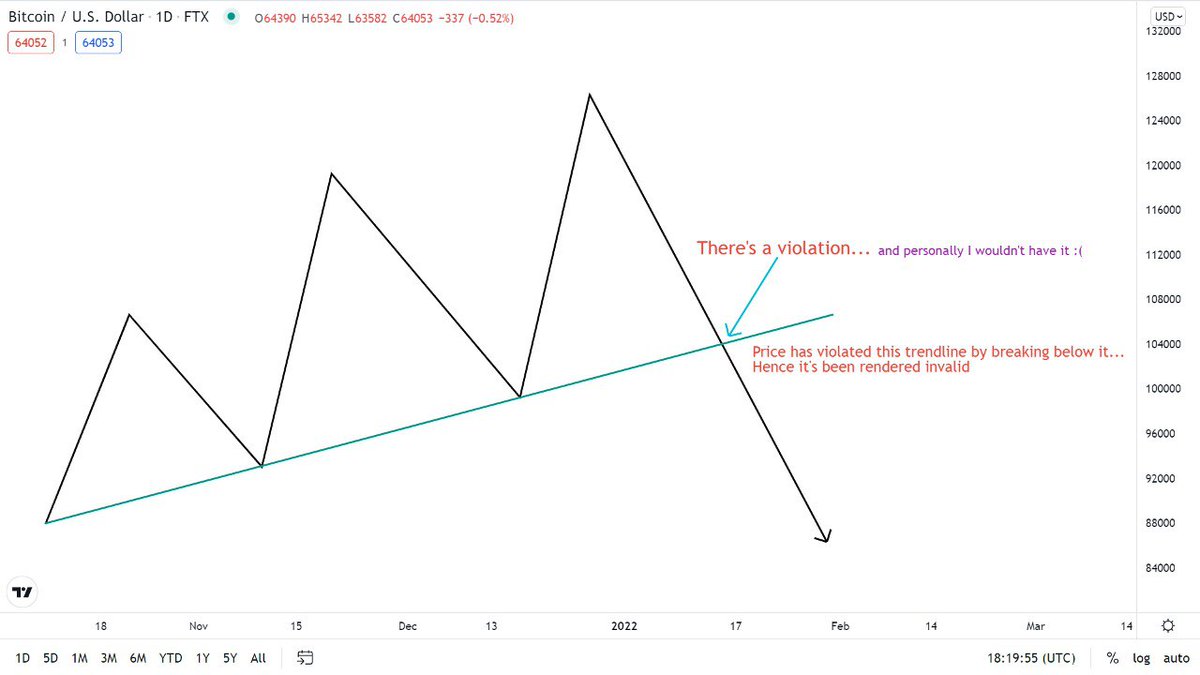
Remember once a trendline is violated, it can be an early indication for a change in market direction though this isn't always the case.
A violated trendline can still serve as a counter-trading pointer.
Eg A violated bullish trendline can help you execute a sell or short..
A violated trendline can still serve as a counter-trading pointer.
Eg A violated bullish trendline can help you execute a sell or short..
position, and a violated bearish trendline can assist in executing a buy or long position.
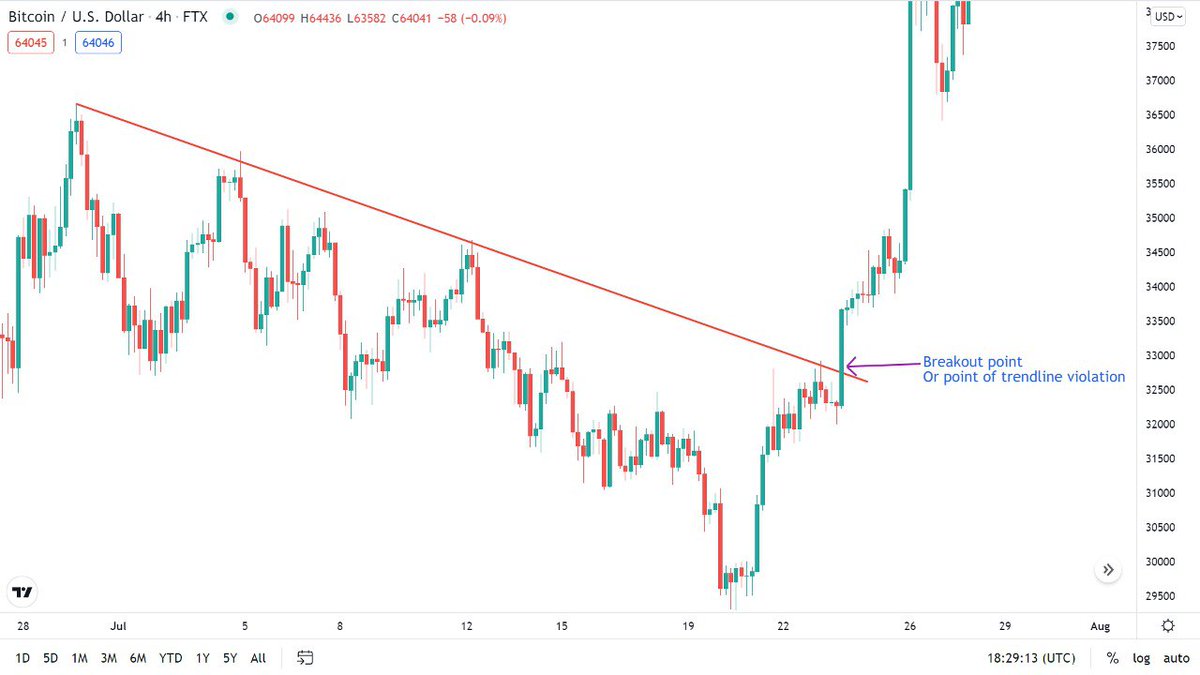
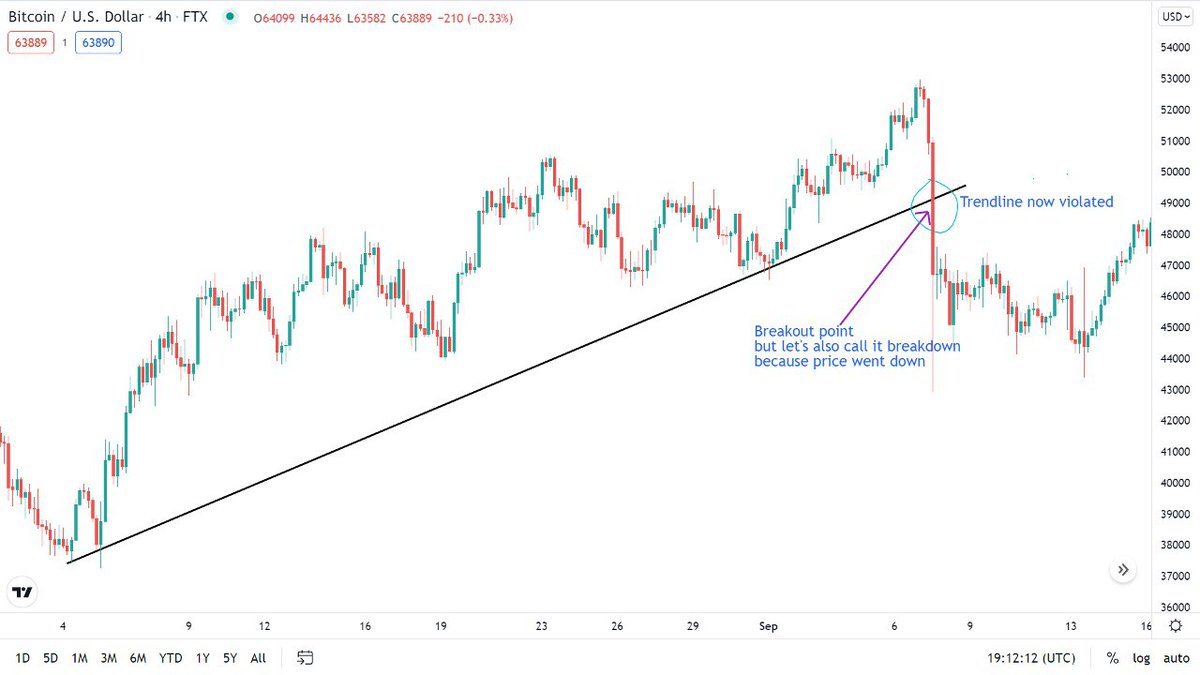
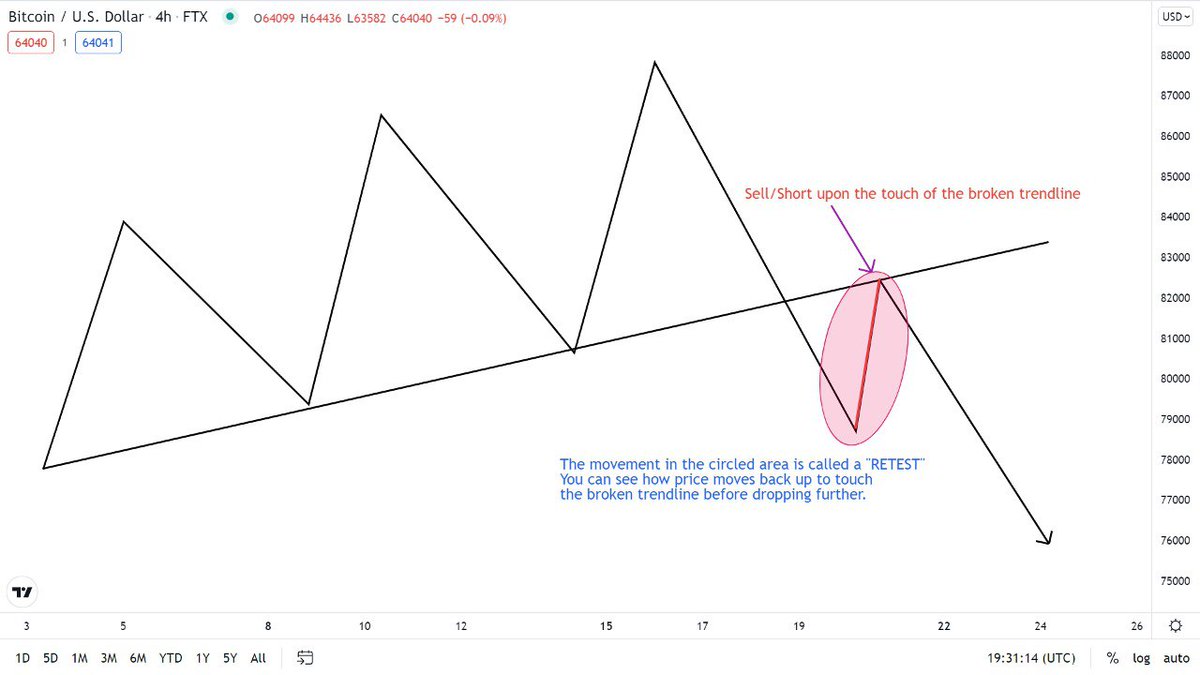
Remember how supports get broken and turns to resistance and vice versa? The same applies to bullish and bearish trendlines too, when they're violated, there is usually a retest of that...
Remember how supports get broken and turns to resistance and vice versa? The same applies to bullish and bearish trendlines too, when they're violated, there is usually a retest of that...
broken trendline that is then followed by a strong move.
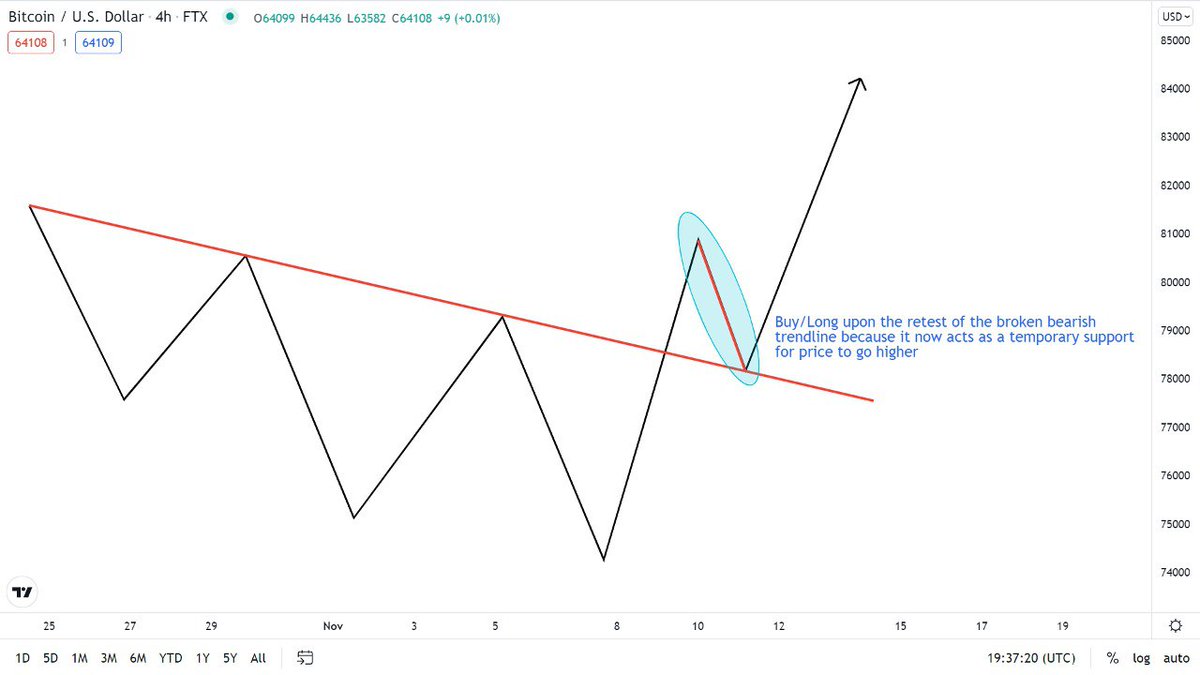
That is when a bullish trendline is broken, price may retrace (return) to touch the broken trendline (from beneath) and then drop further thereby offering you a selling opportunity, and vice versa for a bearish trendline.
That is when a bullish trendline is broken, price may retrace (return) to touch the broken trendline (from beneath) and then drop further thereby offering you a selling opportunity, and vice versa for a bearish trendline.
Now these are different strategies inside a single strategy lol.
There are several trading strategies out there but you don't need to complicate things by trying to know them all, you'll suffer from information paralysis as you'd be stuck on what decision to make due to knowing
There are several trading strategies out there but you don't need to complicate things by trying to know them all, you'll suffer from information paralysis as you'd be stuck on what decision to make due to knowing
"too much".
Achieving consistent results with just a trading strategy can put you ahead of millions of traders, so many claim to know how to trade when in fact they can't and all they do is copytrade others.
There's no need to have complicated charts, simple and easy does it!
Achieving consistent results with just a trading strategy can put you ahead of millions of traders, so many claim to know how to trade when in fact they can't and all they do is copytrade others.
There's no need to have complicated charts, simple and easy does it!
With that being said, let's proceed to the last part of this lecture which is "False breakouts".
Your decision can fail you when it comes to trading, it's all 50-50 hence you must be versatile.
Remember you're not in the market to be right, you're in the market to make money!
Your decision can fail you when it comes to trading, it's all 50-50 hence you must be versatile.
Remember you're not in the market to be right, you're in the market to make money!
Proceeding.
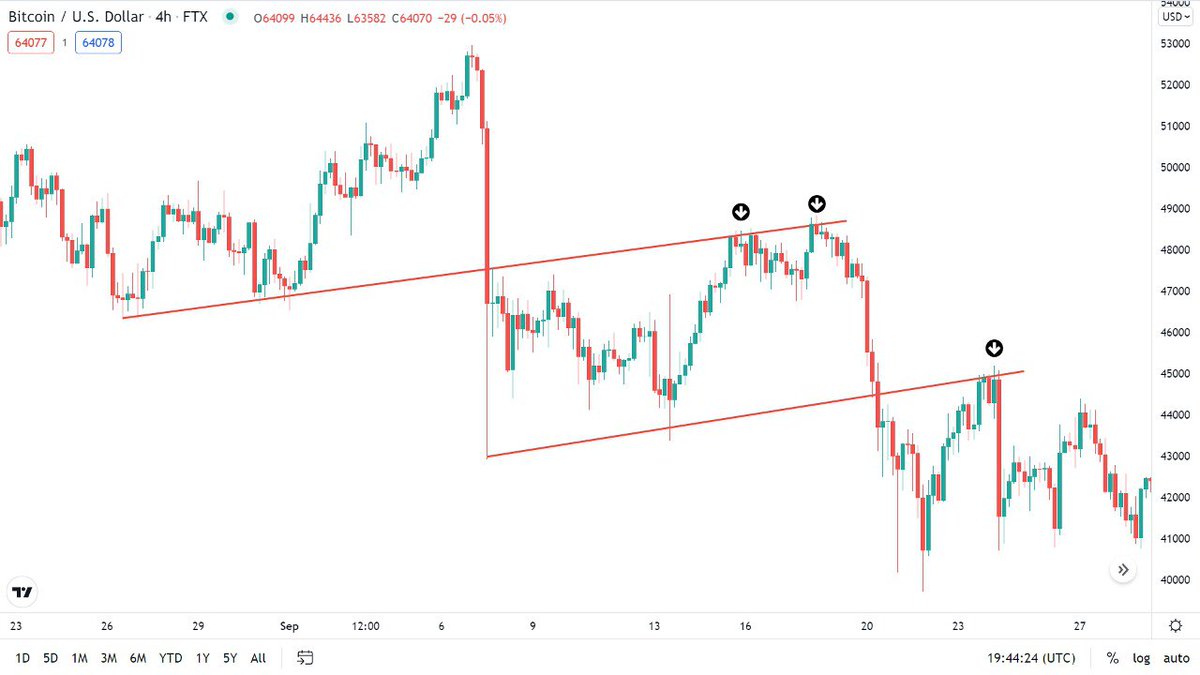
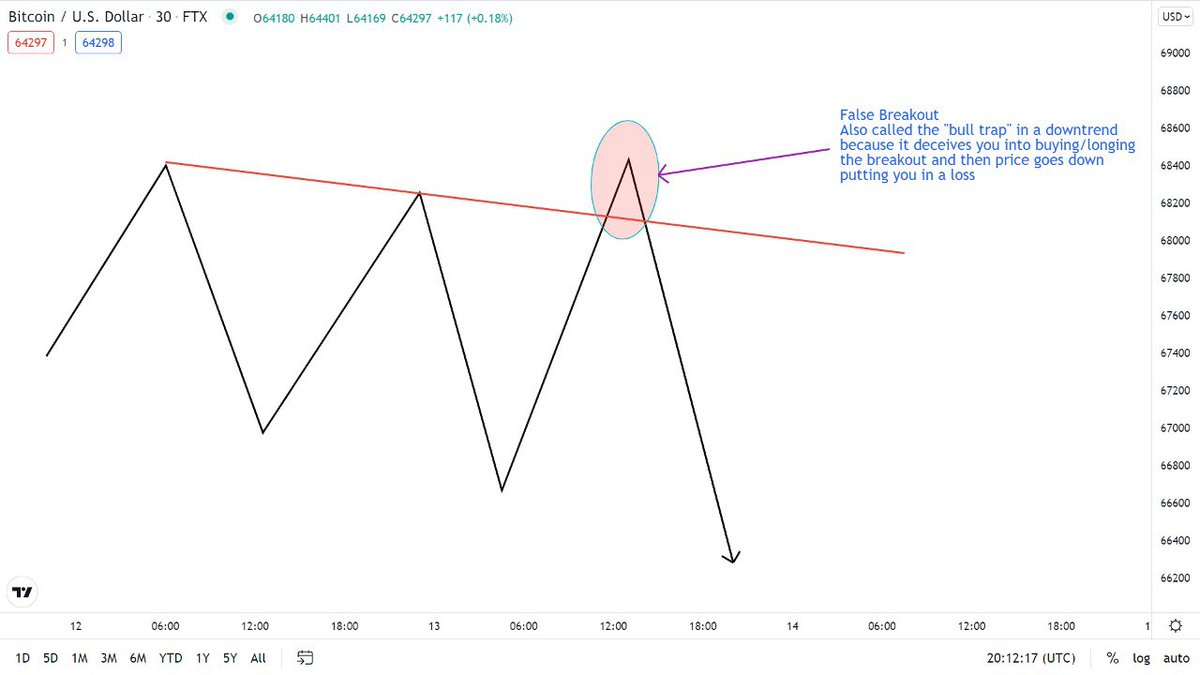
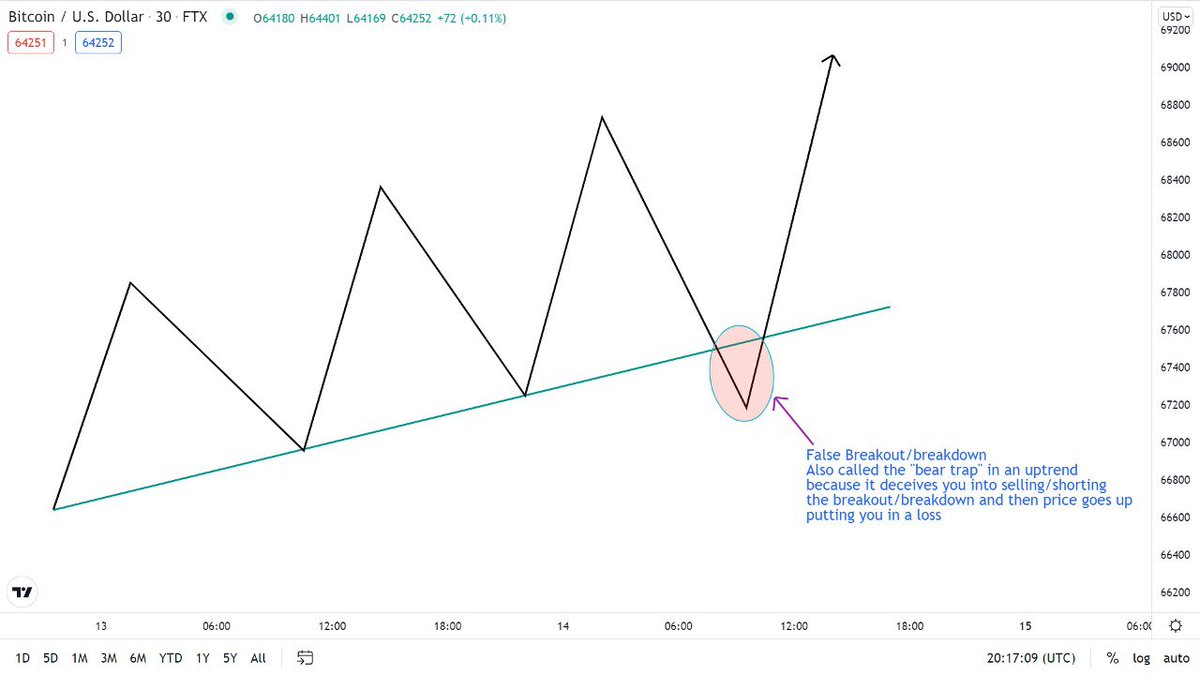
There are times where price makes a feint making you think it's breaking out, and eventually it doesn't & instead of fully breaking out it resumes the former trend. This is called a "Fakeout" - False breakout.
In SMC we call it stop hunt/liquidity grab.
See Images.
There are times where price makes a feint making you think it's breaking out, and eventually it doesn't & instead of fully breaking out it resumes the former trend. This is called a "Fakeout" - False breakout.
In SMC we call it stop hunt/liquidity grab.
See Images.
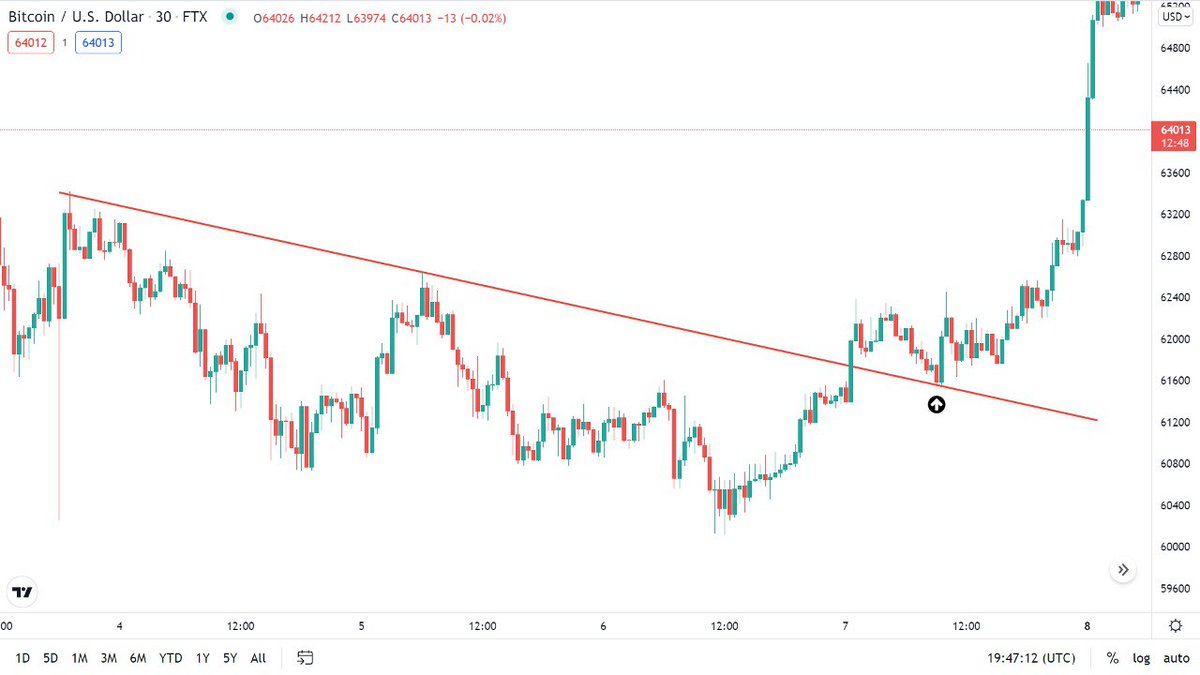
How do you trade Fakeouts?
You never really can because you don't control price, but your best bet is to wait for a retest of the trendline before you execute & if the action turns out to be false, you take your "L" and move. You can't win always, no strategy is 100% guaranteed.
You never really can because you don't control price, but your best bet is to wait for a retest of the trendline before you execute & if the action turns out to be false, you take your "L" and move. You can't win always, no strategy is 100% guaranteed.
Now I want you to pick some pairs on your trading app and analyze them.
Look for these things I've taught you in the charts, and trade with this strategy over and over again, you may not get it all right at first but with consistency it'll all become clearer and you'll be better
Look for these things I've taught you in the charts, and trade with this strategy over and over again, you may not get it all right at first but with consistency it'll all become clearer and you'll be better
We've come to the end of this lecture, I'll still teach more strategies on this especially How to integrate Support and Resistance with Trendline trading to give you a clearer understanding of the chart and getting clean trades.
That'll be our next topic.
That'll be our next topic.
Till then I remain your favorite Crypto Coach and Analyst @ThePaulOla
Follow & turn on post notifications for more trading updates and lectures.
You can also Join my Telegram channel where we discuss crypto and drop gems.👇
T.me
To your trading success.💙
Follow & turn on post notifications for more trading updates and lectures.
You can also Join my Telegram channel where we discuss crypto and drop gems.👇
T.me
To your trading success.💙
Loading suggestions...