

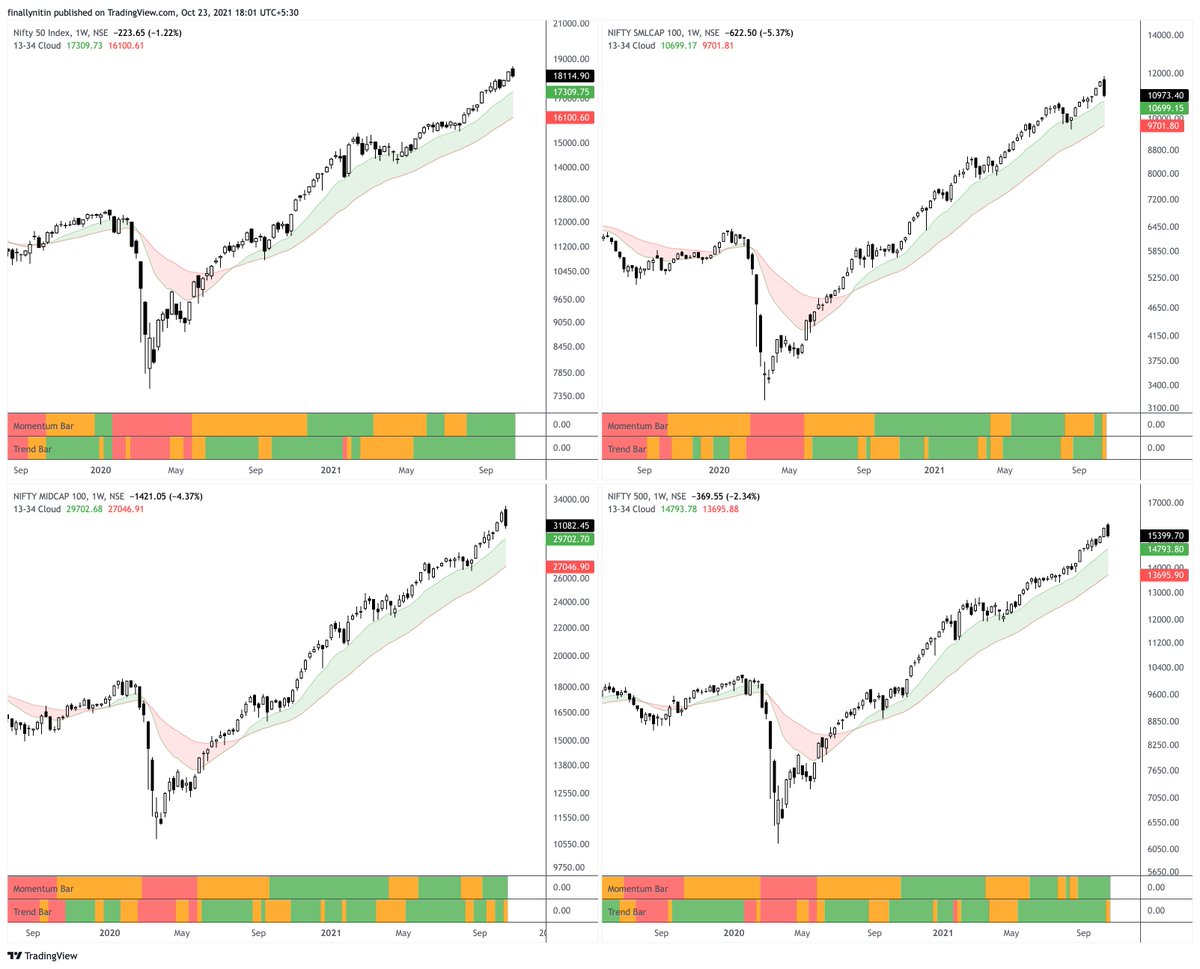
#WeeklyIndexCheck CW41/2021
Other than FMCG index, the uptrend is intact. Smallcap index losing momentum. Most indices forming bearish engulfing or dark cloud cover on weekly charts. Market breadth nearing oversold on short-term charts.
Other than FMCG index, the uptrend is intact. Smallcap index losing momentum. Most indices forming bearish engulfing or dark cloud cover on weekly charts. Market breadth nearing oversold on short-term charts.
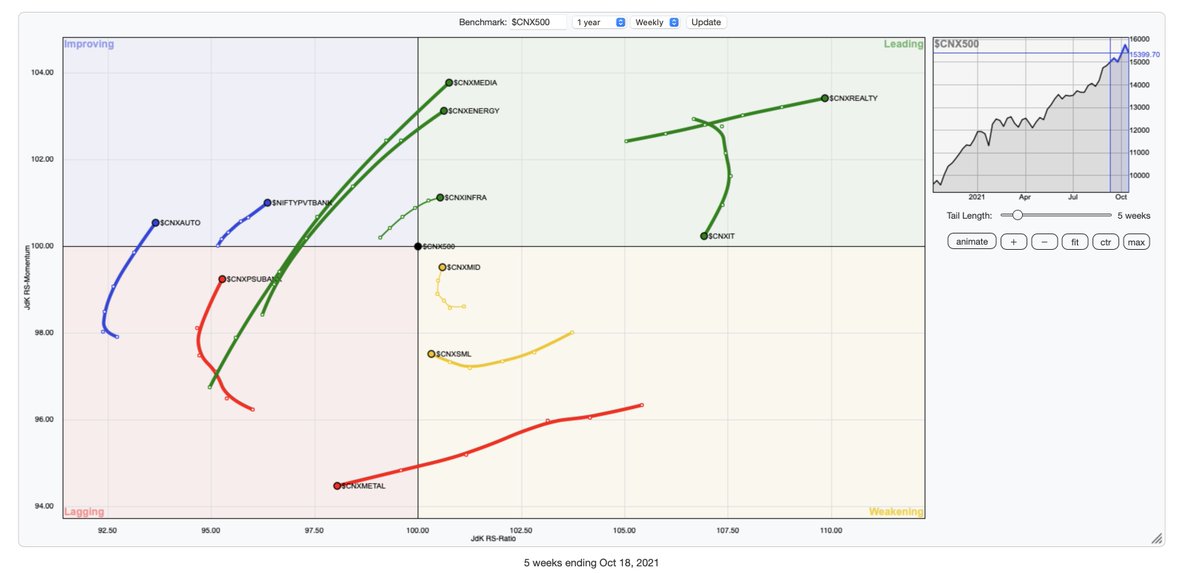
On Weekly RRG charts, compared to CNX500:
⦿ Media & Energy enter the leading quadrant. Realty is leading & still gaining momentum.
⦿ IT getting ready to exit the leading quadrant
⦿ Auto index & banks (esp. PSUbanks) gaining momentum
⦿ Media & Energy enter the leading quadrant. Realty is leading & still gaining momentum.
⦿ IT getting ready to exit the leading quadrant
⦿ Auto index & banks (esp. PSUbanks) gaining momentum
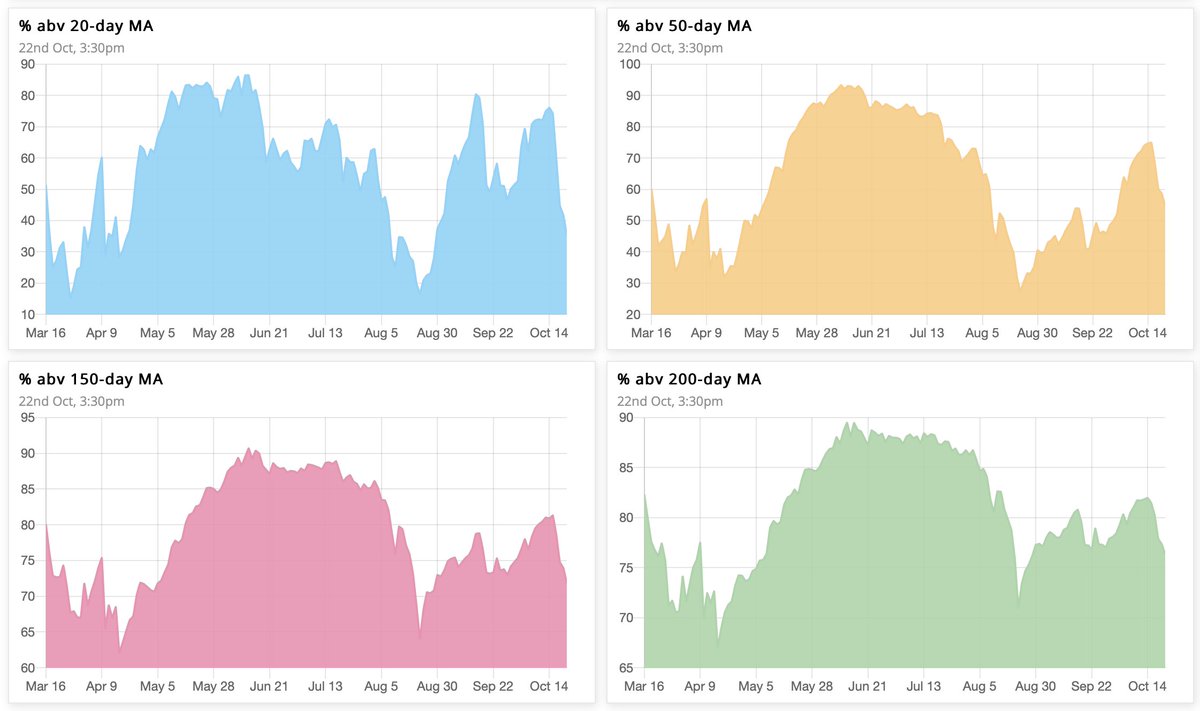
Market breadth nearing oversold on short-term charts.
⦿ 76% → 35% above 20 SMA (nearing oversold)
⦿ 74% → 54% above 50 SMA (neutral)
⦿ 80% → 71% above 150 SMA (bullish bias)
⦿ 82% → 76% above 200 SMA (bullish bias)
⦿ 76% → 35% above 20 SMA (nearing oversold)
⦿ 74% → 54% above 50 SMA (neutral)
⦿ 80% → 71% above 150 SMA (bullish bias)
⦿ 82% → 76% above 200 SMA (bullish bias)
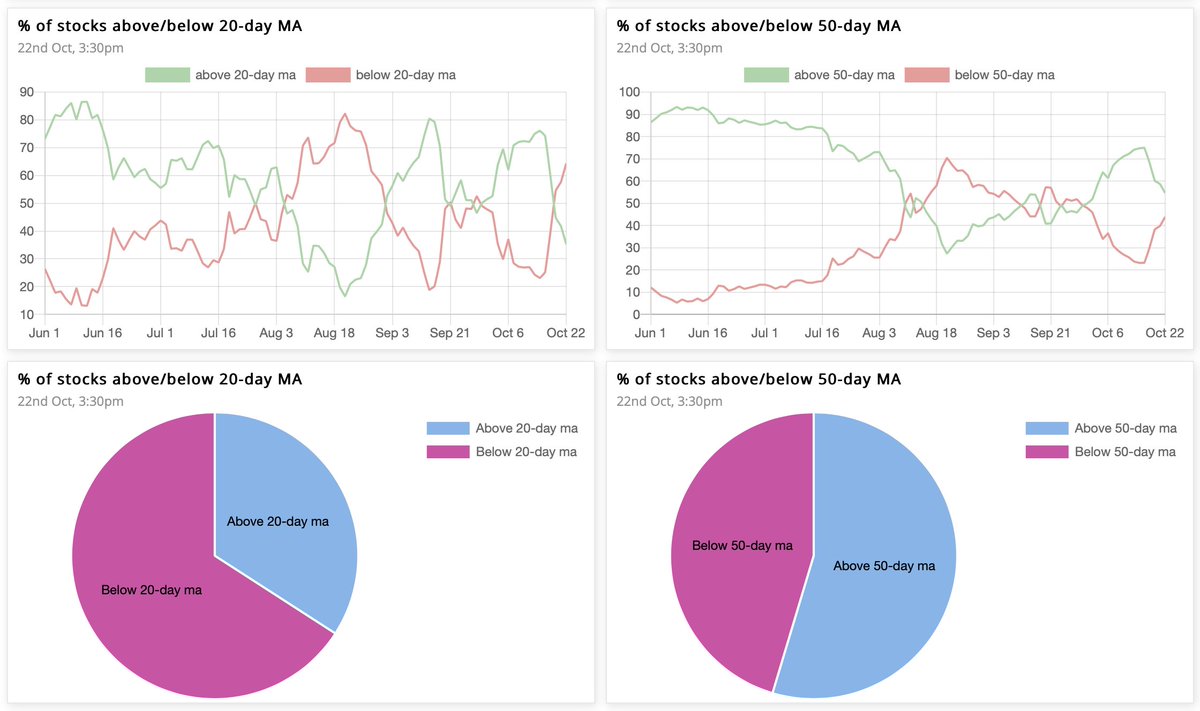
The Ratio between stocks above & below 50MA is 1.2, while that for 20MA is 0.5. Bulls would like to see the green line crossing above the red one in the 20-MA graph, & pointing upwards in the 50-MA graph.
Loading suggestions...