

Market breadth measures the degree of participation & the conviction in the overall mood of the underlying index. A positive market breadth is said to happen when more stocks are advancing than are declining.
A thread on how do we interpret market breadth👇
A thread on how do we interpret market breadth👇
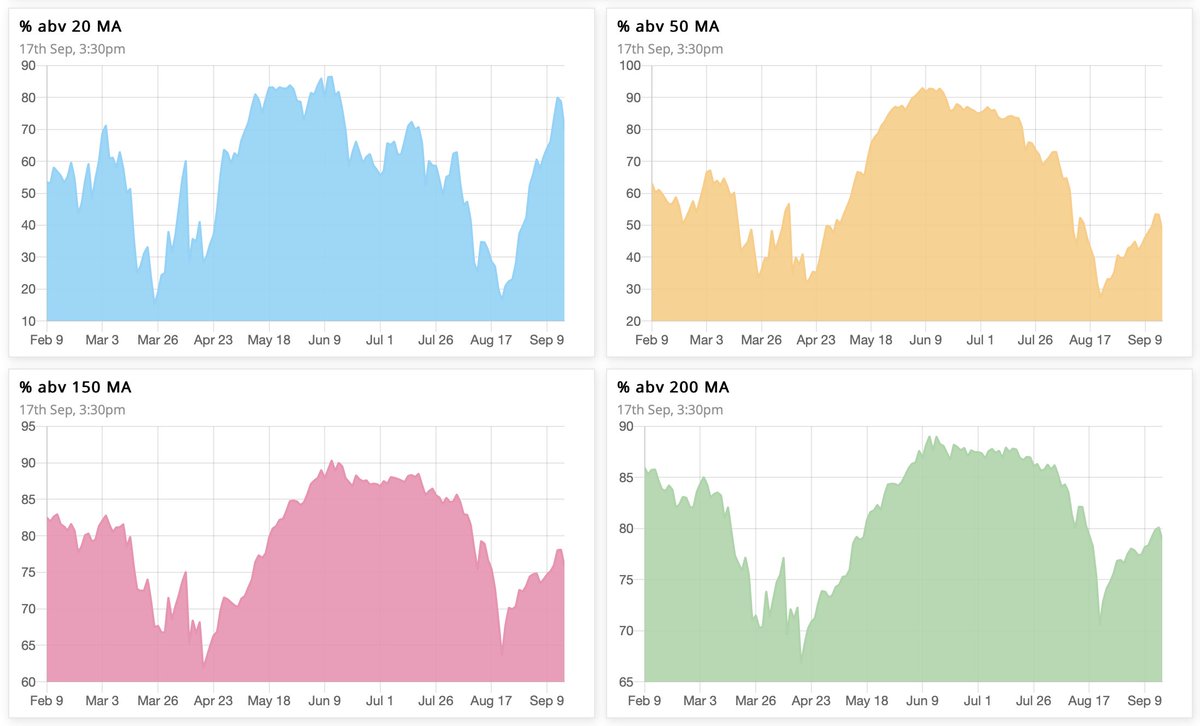
A simple way to measure market breadth is % of stocks trading above a certain moving average. When majority are above a specific MA, market breadth is termed strong.
We use 20 & 50-day MA for short to medium-term timeframes, & 150 & 200-day MA for medium to long-term timeframes.
We use 20 & 50-day MA for short to medium-term timeframes, & 150 & 200-day MA for medium to long-term timeframes.
Bullish/bearish bias
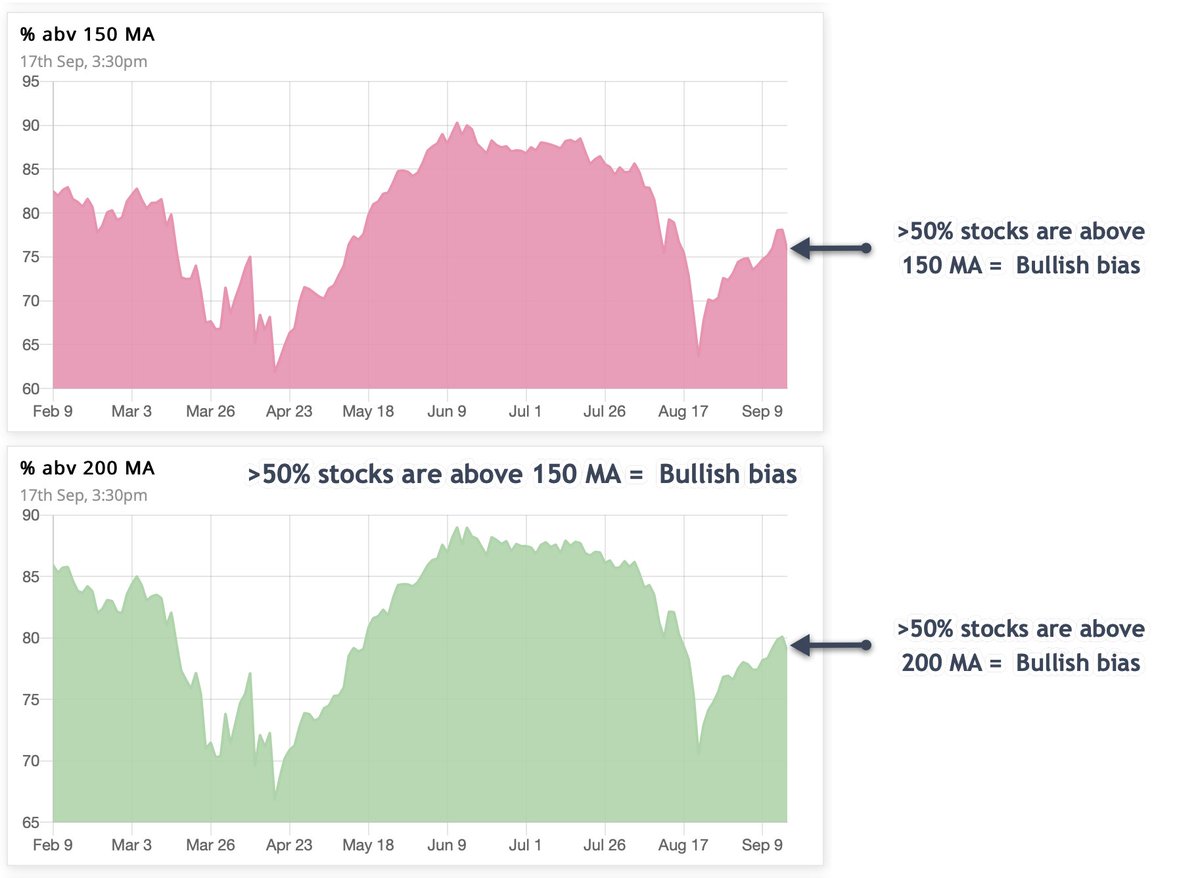
We have a bullish bias when >50% of stocks are above their 150 & 200-day MA. We don't see the longer-term timeframes for oversold/overbought levels.
We have a bullish bias when >50% of stocks are above their 150 & 200-day MA. We don't see the longer-term timeframes for oversold/overbought levels.
Oversold/overbrought
Look at short-term timeframes for overbought and oversold levels.
>70-80%: overbought
<30-20%: oversold
Extended market breadth doesn't necessarily indicate reversal, but rather exhaustion, which resolves by either a price correction or a time corrrection.
Look at short-term timeframes for overbought and oversold levels.
>70-80%: overbought
<30-20%: oversold
Extended market breadth doesn't necessarily indicate reversal, but rather exhaustion, which resolves by either a price correction or a time corrrection.

Overbought market breadth doesn’t tell us to rush to exit all our holdings.
We instead need to:
- Ideally: Avoid initiating fresh longs
- Next to ideal: Avoid fresh breakouts
- At the very least: Reduce position size
As @Prashantshah267 says, "Breadth tells us what not to do”.
We instead need to:
- Ideally: Avoid initiating fresh longs
- Next to ideal: Avoid fresh breakouts
- At the very least: Reduce position size
As @Prashantshah267 says, "Breadth tells us what not to do”.
Fresh buy signal
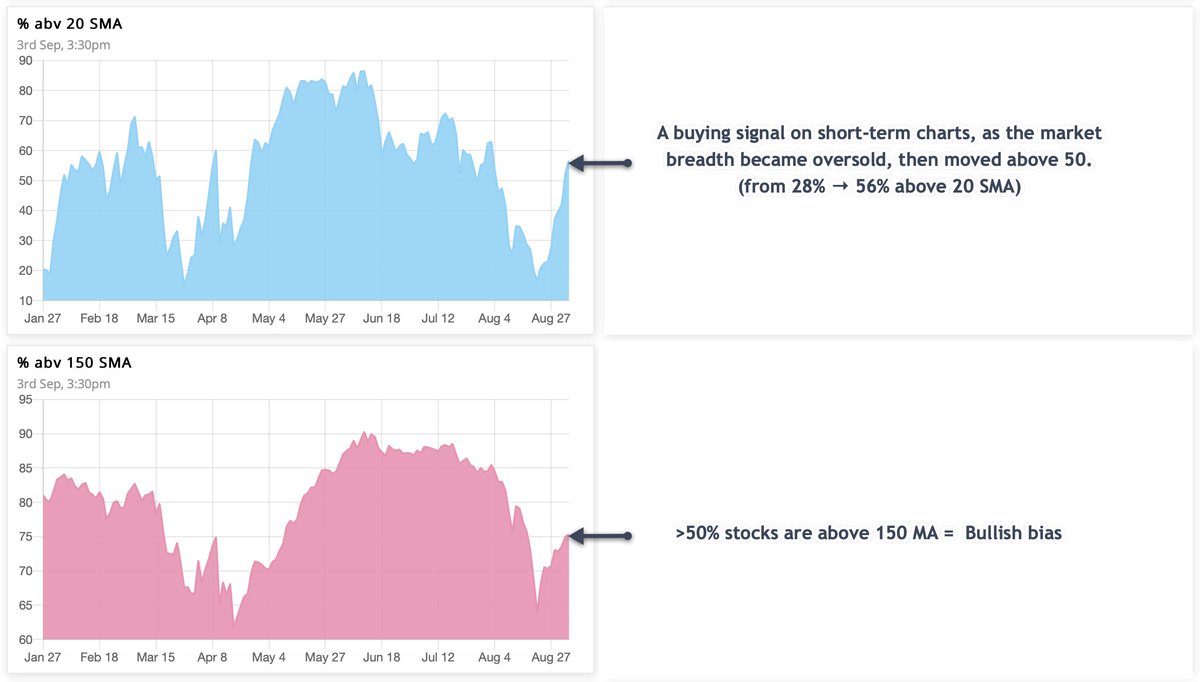
With >50% stocks already above 150 & 200 MA, we get a signal for initiating fresh longs on short-term timeframes if the 50MA market breadth first goes oversold & then crosses above 50%.
With >50% stocks already above 150 & 200 MA, we get a signal for initiating fresh longs on short-term timeframes if the 50MA market breadth first goes oversold & then crosses above 50%.
Swing-trading
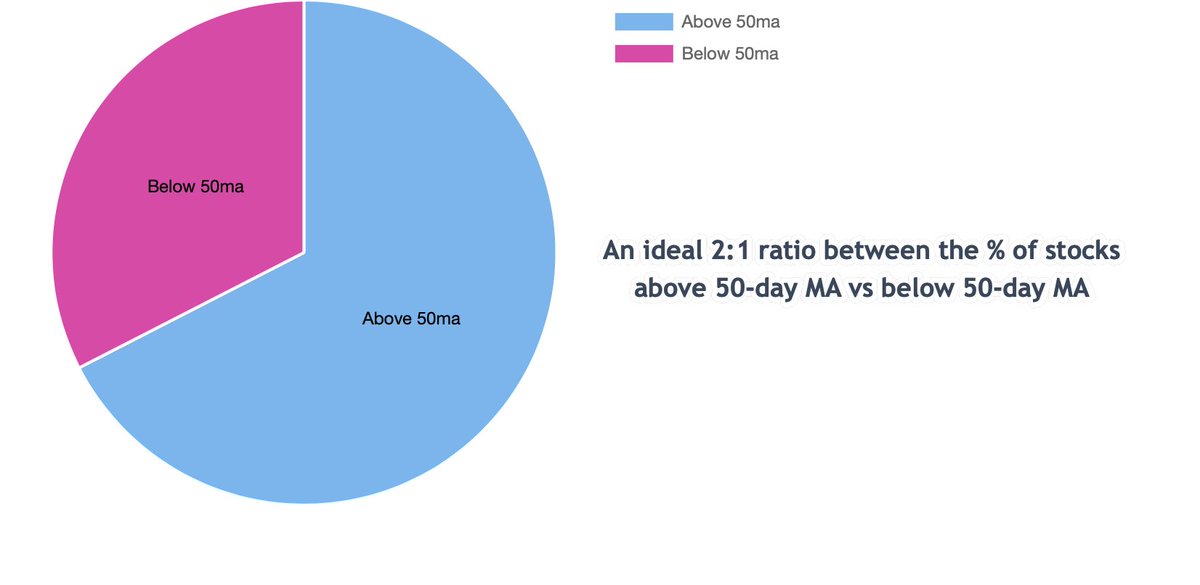
For swing-trading, we would love to see a 2:1 ratio between the % of stocks above 50-day MA vs below 50-day MA. A ratio below 1:1 is not healthy & the probability of getting big moves is less.
For swing-trading, we would love to see a 2:1 ratio between the % of stocks above 50-day MA vs below 50-day MA. A ratio below 1:1 is not healthy & the probability of getting big moves is less.
Divergence
Can the index rally, but the market breadth fall?
Yes, when a small number of stocks rally so much that they move entire market higher.
Similarly, a bullish divergence is when the underlying index moves lower but the market breadth does not breach its previous low.
Can the index rally, but the market breadth fall?
Yes, when a small number of stocks rally so much that they move entire market higher.
Similarly, a bullish divergence is when the underlying index moves lower but the market breadth does not breach its previous low.
What is the ideal scenario?
A rally with decreasing market breadth is less sustainable. A person with a bullish view would love to see the market rallying with increasing market breadth that is not extended on short-term charts.
A rally with decreasing market breadth is less sustainable. A person with a bullish view would love to see the market rallying with increasing market breadth that is not extended on short-term charts.
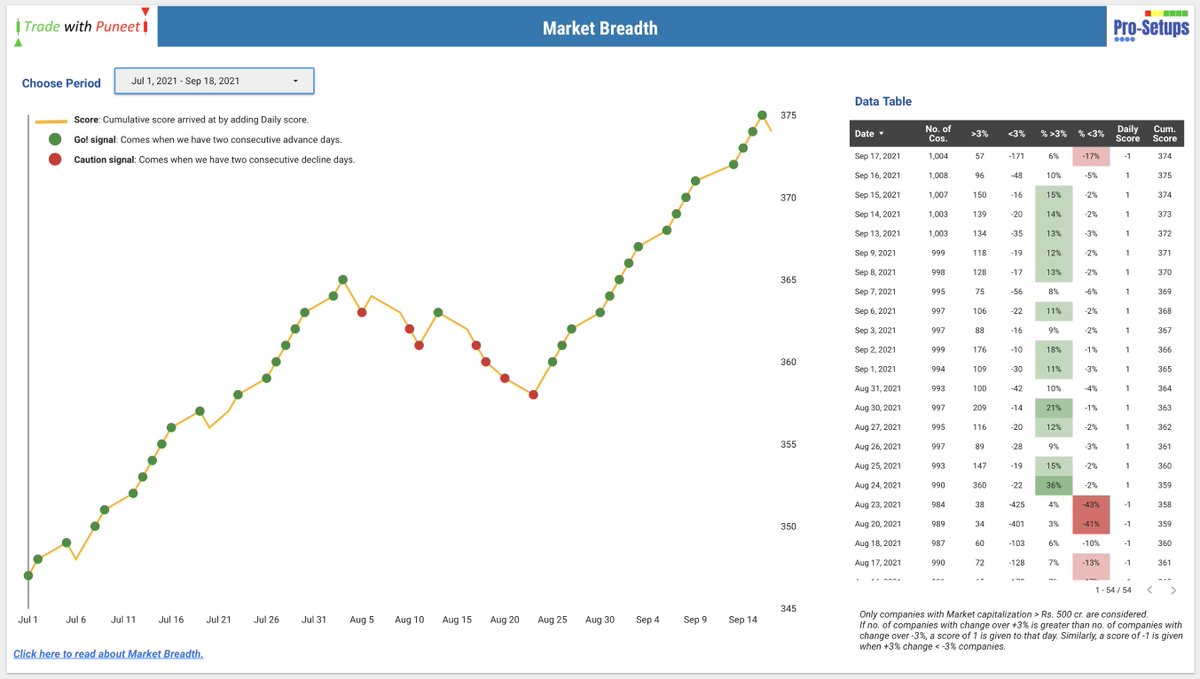
Another fine way for judging the market breadth is by using @tradewithpuneet’s dashboard.
This system uses an adjusted advance-decline ratio, comparing the number of stocks that are closing 3% positive vs the stocks that are closing 3% negative compared to their previous close.
This system uses an adjusted advance-decline ratio, comparing the number of stocks that are closing 3% positive vs the stocks that are closing 3% negative compared to their previous close.
That’s all! Hope all this made some sense. Thanks to @varunmehta for asking me to write this up.
Loading suggestions...