

#BTC
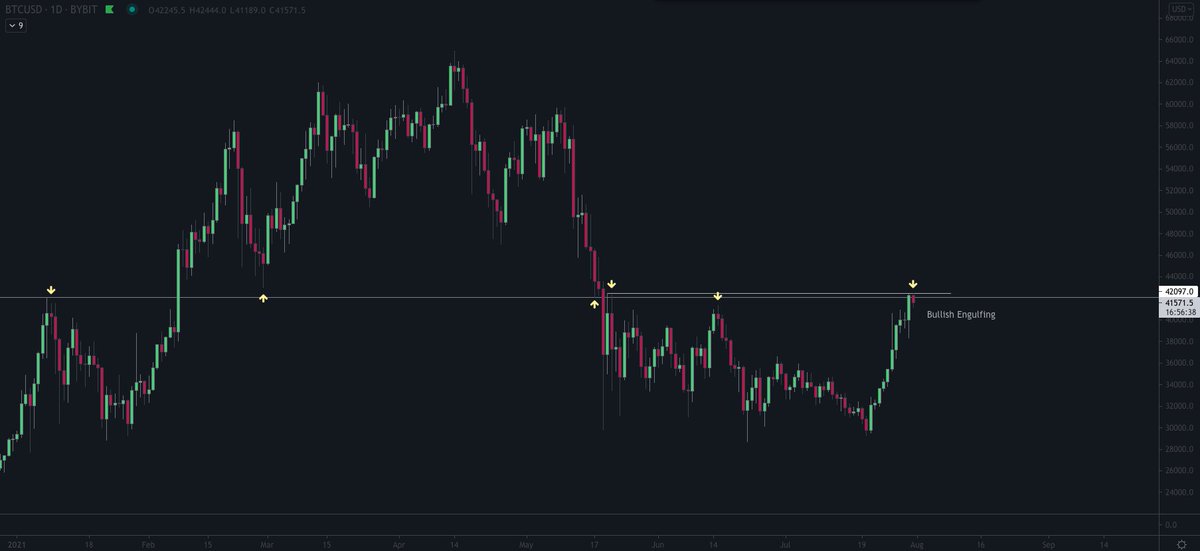
Taking a look at the daily chart we have a bullish engulfing. Usually i'd be quite bullish after that but as always context is key.
The problem we have is that it's right at resistance as shown. Huge level here. So i'm neutral here waiting for ltf entries.
Taking a look at the daily chart we have a bullish engulfing. Usually i'd be quite bullish after that but as always context is key.
The problem we have is that it's right at resistance as shown. Huge level here. So i'm neutral here waiting for ltf entries.
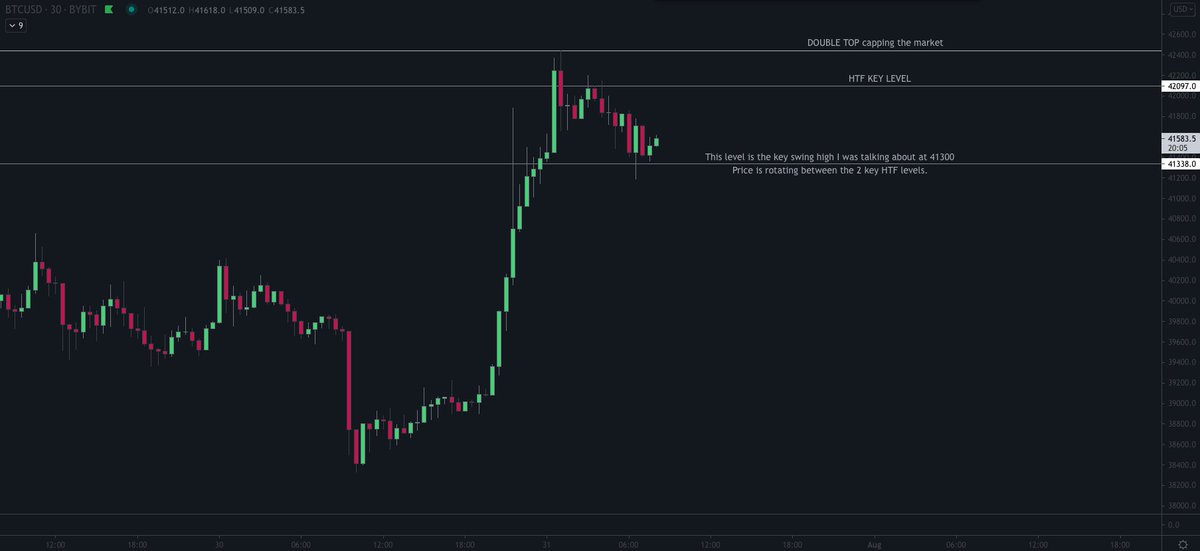
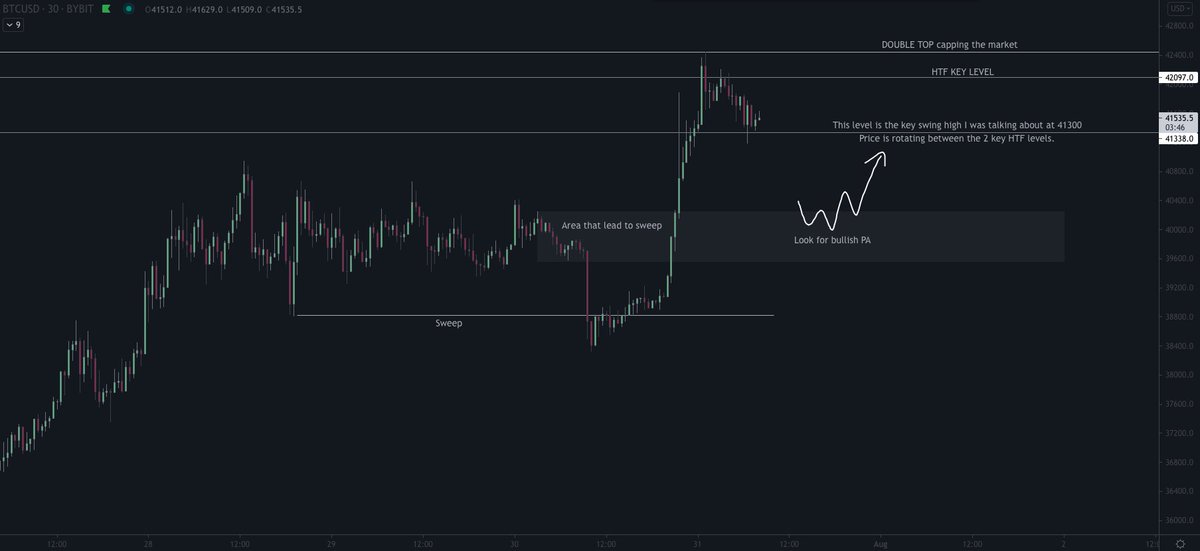
If we look at the 30 minute chart we see price trading between the key swing high I was talking about during the week at 41300 and the HTF key weekly level to the upside.
This is a scalpers range or for intra day positional plays. Until one side caves in I have no HTF bias here.
This is a scalpers range or for intra day positional plays. Until one side caves in I have no HTF bias here.
Here is the #BTC profile showing the range followed by the breakout
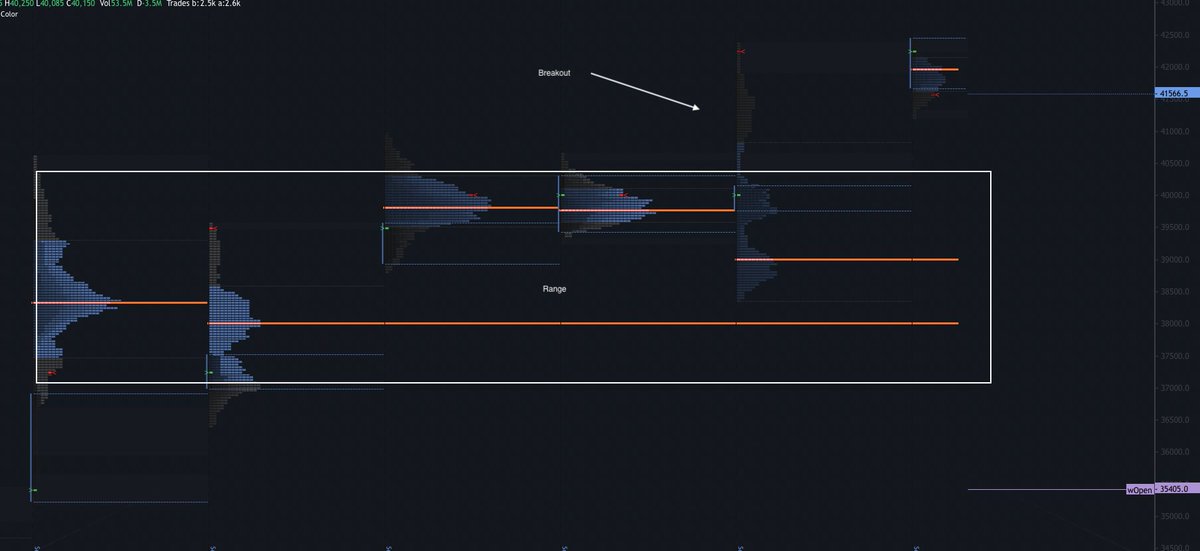
Something I like to do is to combine the profiles within the range to get a view of where most of the volume was. As we can see 40k is a key area.
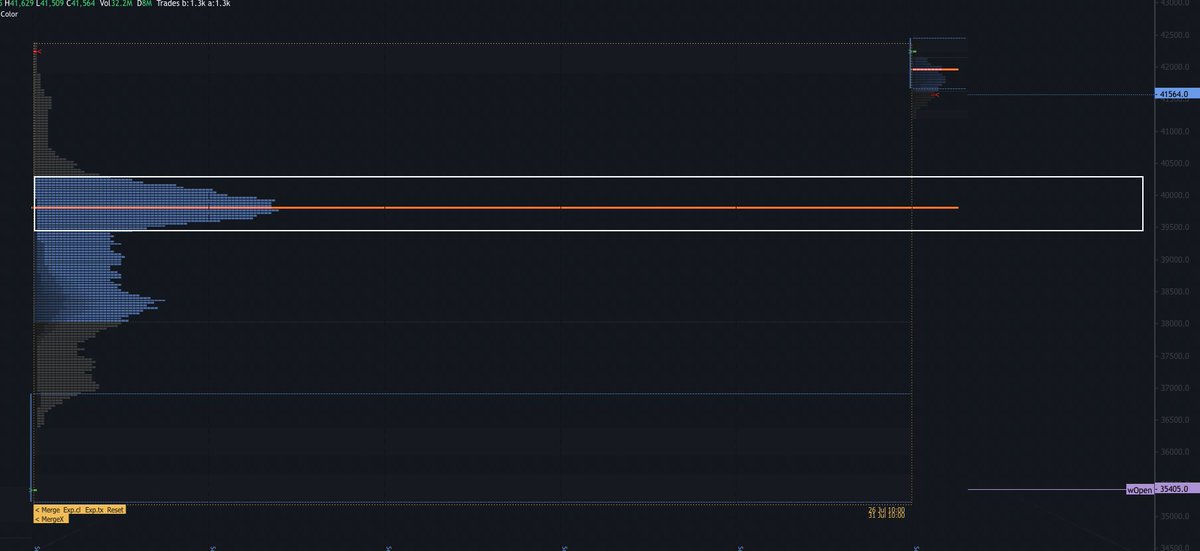
Now when we look at this on the 30 minute chart (using that area marked on the profile chart) we can use simple price action concepts to frame trade ideas.
Here is what I'd be looking for if price moved lower #BTC
Here is what I'd be looking for if price moved lower #BTC
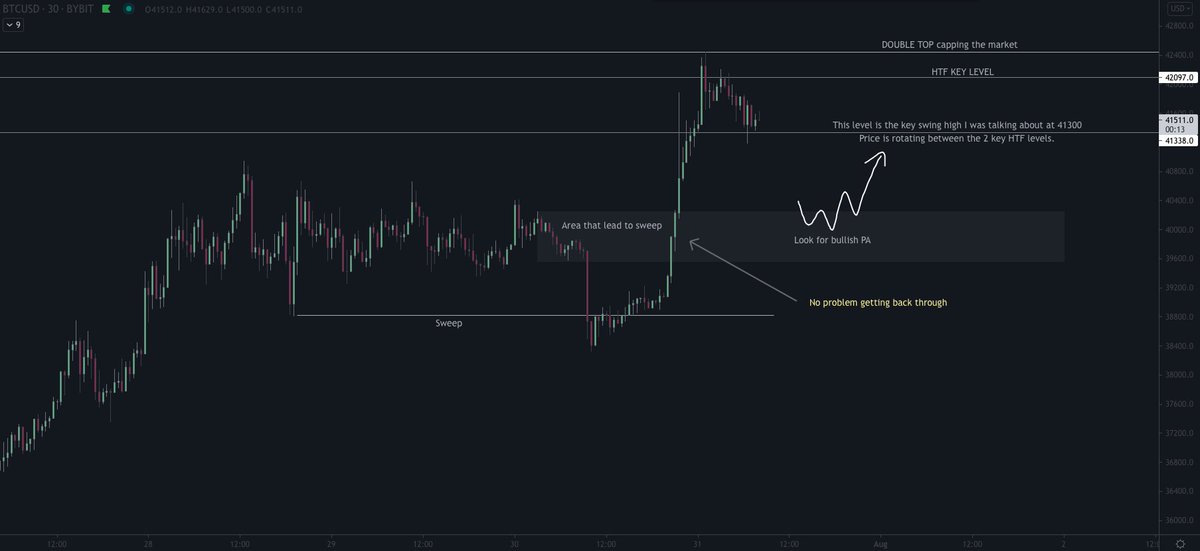
Also notice how we had the sweep of the swing low then price smashed straight back through the area that lead to it.
Whenever I see that I expect price to hold from the other side. Would rather it came down to the area FIRST before moving higher through the key HTF level.
Whenever I see that I expect price to hold from the other side. Would rather it came down to the area FIRST before moving higher through the key HTF level.
Loading suggestions...