

Previously I made an introductory thread explaining Technical Analysis for beginners and simplified how to read price direction on the charts. 📈📉
Here's the second part explaining more on reading and interpretation of charts and Candlesticks.📊
A #Thread.
RETWEET (PART 2)🙂💥
Here's the second part explaining more on reading and interpretation of charts and Candlesticks.📊
A #Thread.
RETWEET (PART 2)🙂💥
In the previous part, I talked about market structure and how the first thing to do in technical analysis is to identify the trend, that is the direction of which the price of a Cryptocurrency is moving.
And I also explained the types of trends which are:
- Uptrend
- Downtrend.
And I also explained the types of trends which are:
- Uptrend
- Downtrend.
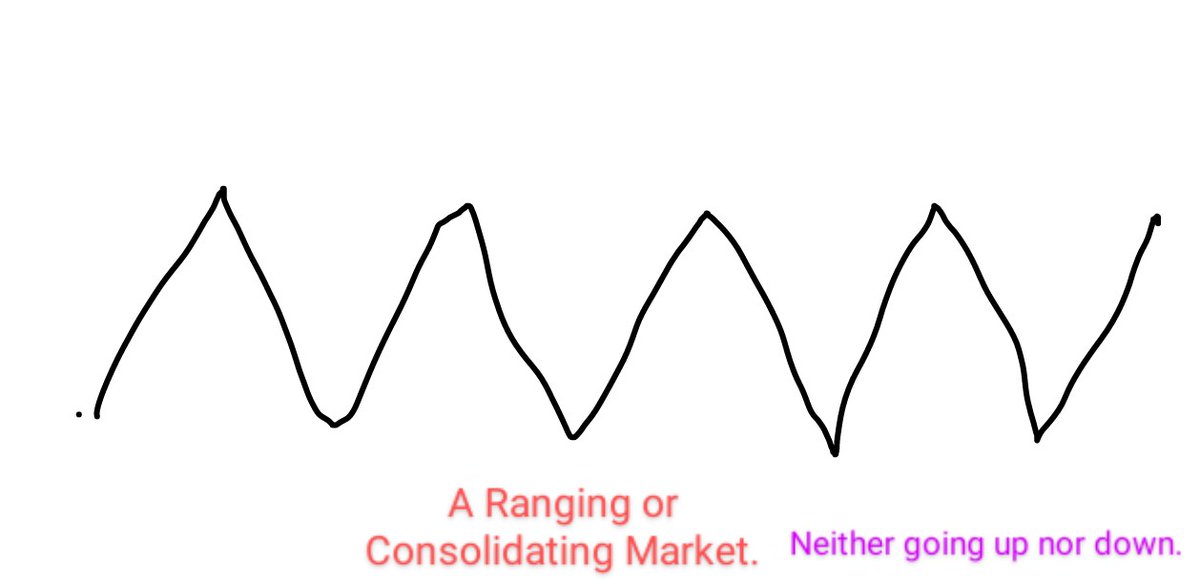
Now you need to understand that the market doesn't make trends always, we do have situations where price would remain constant at an area, we call this a "SIDEWAYS TREND" or consolidation or a ranging market.
That is the market is neither in an uptrend nor a downtrend eg.👇
That is the market is neither in an uptrend nor a downtrend eg.👇
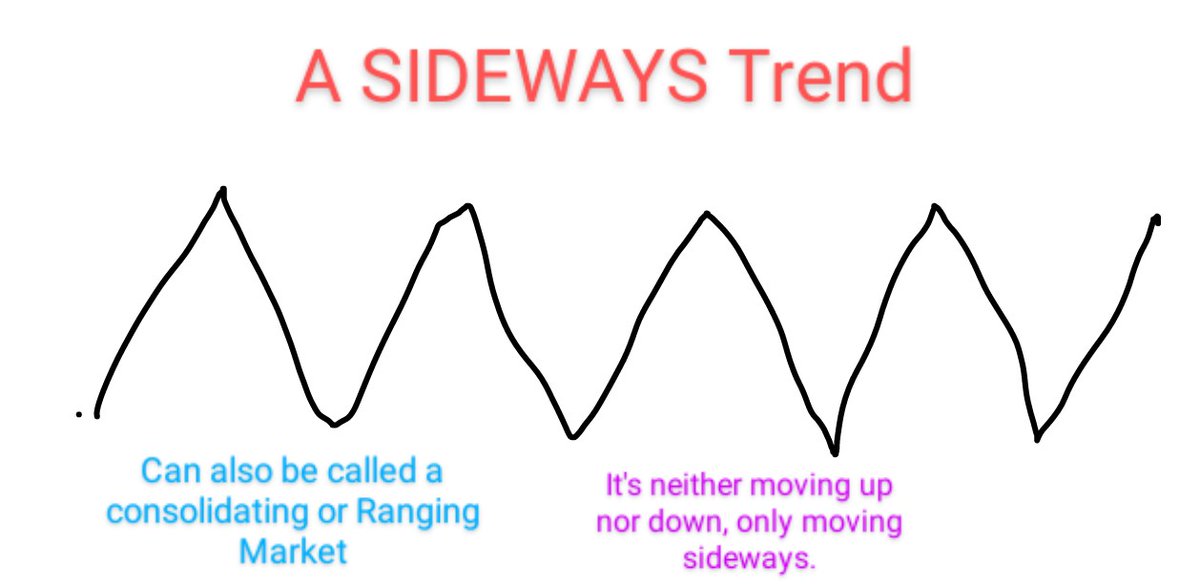
With the image above, we can deduce that the market is in a range or currently consolidating and is yet to make a solid move to a direction.
Now let's get practical.
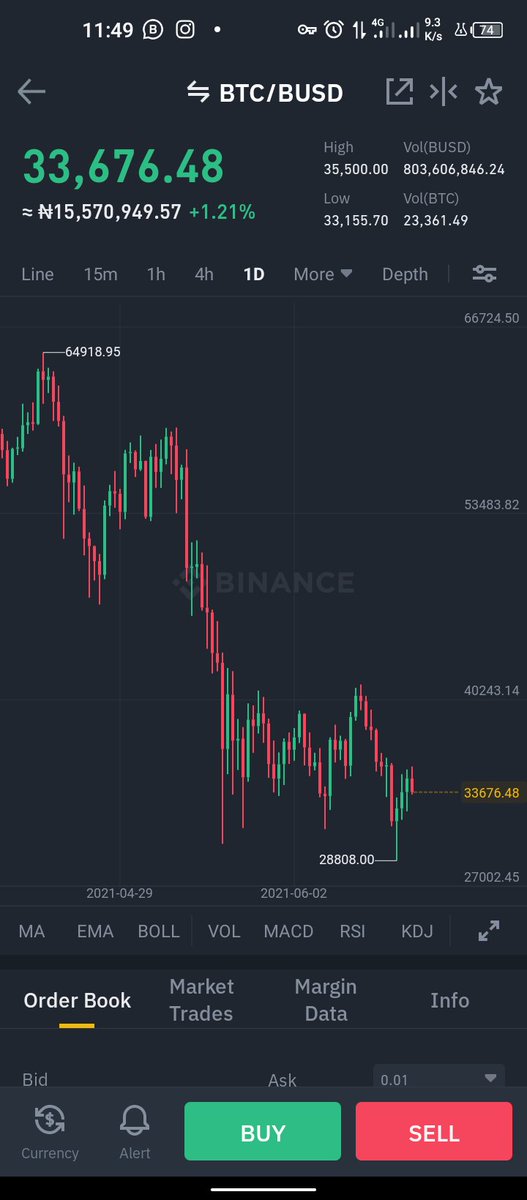
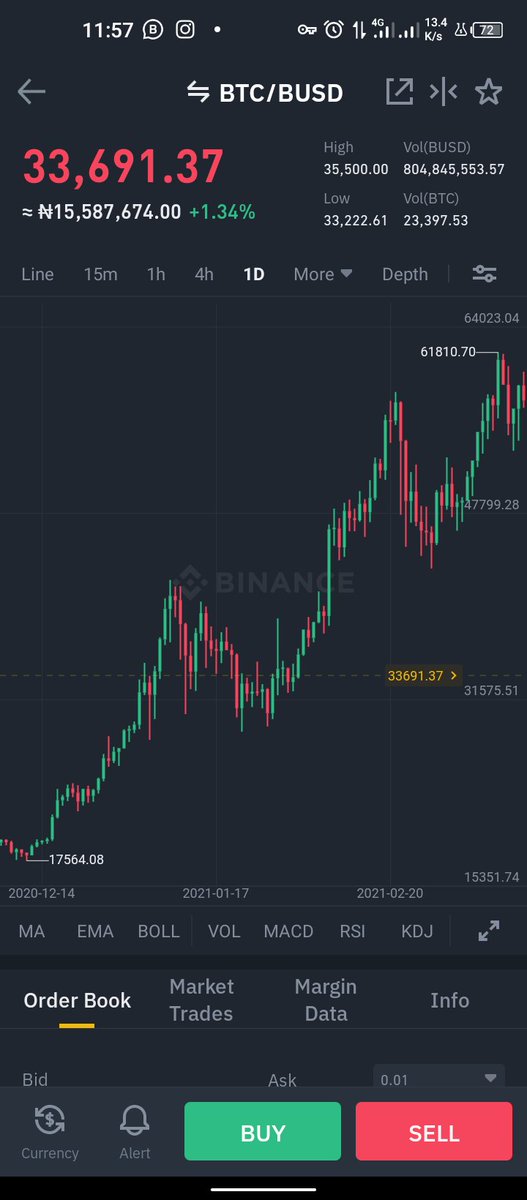
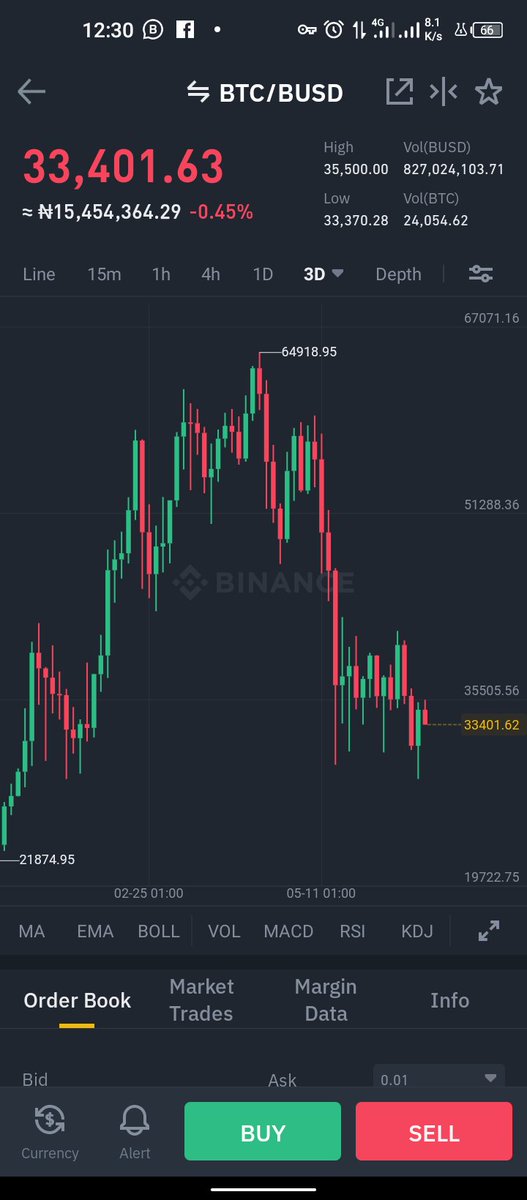
Open your Binance app and search for #Bitcoin using the $BTC/BUSD pair.
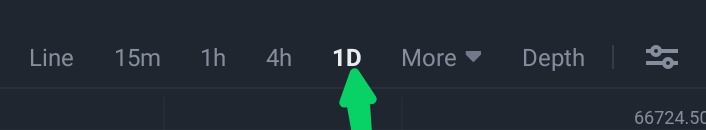
Click on 1D to change to a daily Chart.
Now let's get practical.
Open your Binance app and search for #Bitcoin using the $BTC/BUSD pair.
Click on 1D to change to a daily Chart.

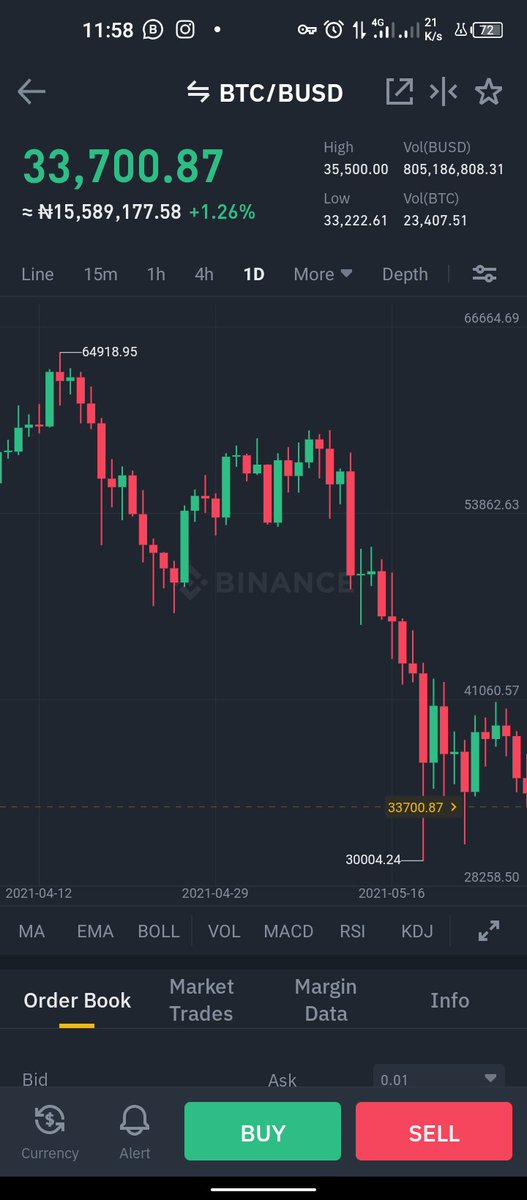
Zoom out and you can see price was previously in a strong downtrend because it was falling.
But currently you can see it's not making any strong move recently because it looks like it's playing around the area I circled.
This simply means BTC is consolidating within that range.
But currently you can see it's not making any strong move recently because it looks like it's playing around the area I circled.
This simply means BTC is consolidating within that range.

So what do you do in a market like this?
The best advice is to stay out of the market and wait for price to make a "bold" move before you make any trading decision.
Now if you still don't understand how to identify trends on your chart, here are images to assist you.
The best advice is to stay out of the market and wait for price to make a "bold" move before you make any trading decision.
Now if you still don't understand how to identify trends on your chart, here are images to assist you.
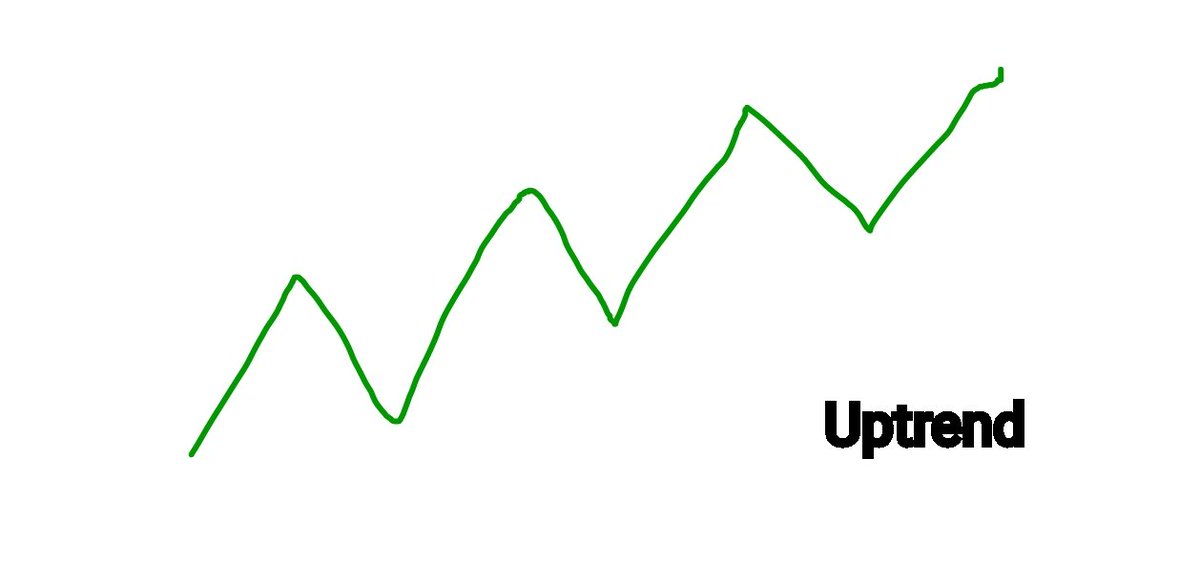
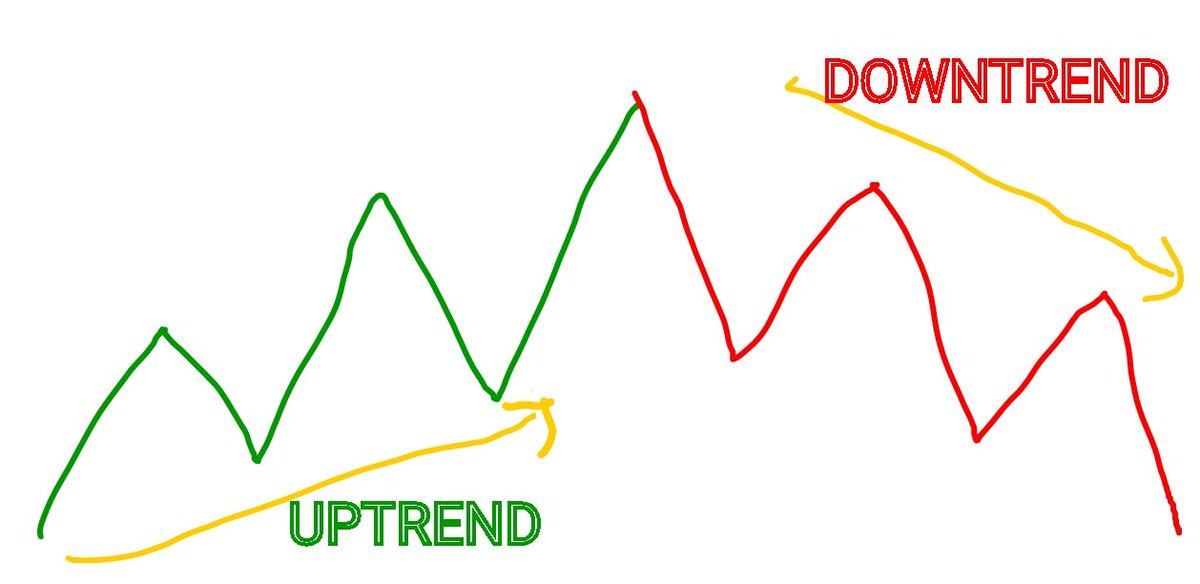
UPTREND. (Upward movement of price)📈
INTERPRETATION: This is when the market is bullish and price pumps.🚀
SIGNAL: Time to Buy.
INTERPRETATION: This is when the market is bullish and price pumps.🚀
SIGNAL: Time to Buy.

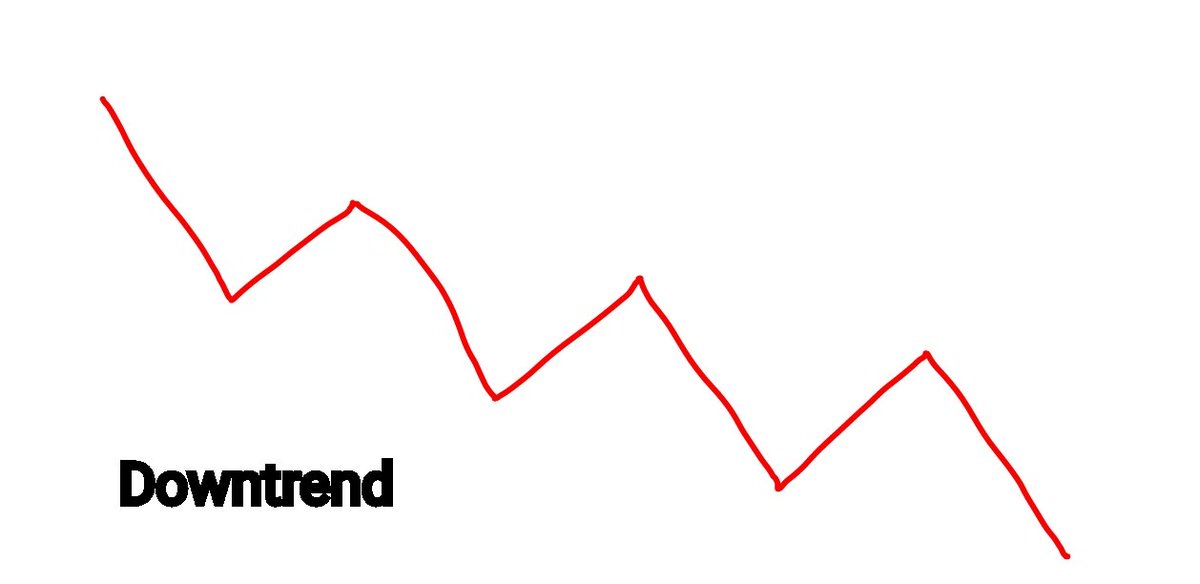
DOWNTREND. (Downward movement of price) 📉
INTERPRETATION: This is when the market is bearish and price falls.
SIGNAL: Time to Sell.
INTERPRETATION: This is when the market is bearish and price falls.
SIGNAL: Time to Sell.

SIDEWAYS TREND or RANGE/CONSOLIDATION.
INTERPRETATION: This is a period when buyers (who want price to go up) and sellers (who want price to go down) are fighting for dominance of price control.
SIGNAL: Time to stay out of the Market and wait for a bold move from the market.
INTERPRETATION: This is a period when buyers (who want price to go up) and sellers (who want price to go down) are fighting for dominance of price control.
SIGNAL: Time to stay out of the Market and wait for a bold move from the market.

However, just like I told you in the previous part, the trend of a market does not continue forever, the trend of a market changes always from bullish to bearish and vice versa just like we can see here.
This is simply what we call a change in market structure.
This is simply what we call a change in market structure.
Now you know how to interprete market charts in a simple way by using trends and know what decisions to make and when to make them.
Congratulations for reaching this point..🙂
Now it's time to go deeper on Candlesticks.
Congratulations for reaching this point..🙂
Now it's time to go deeper on Candlesticks.
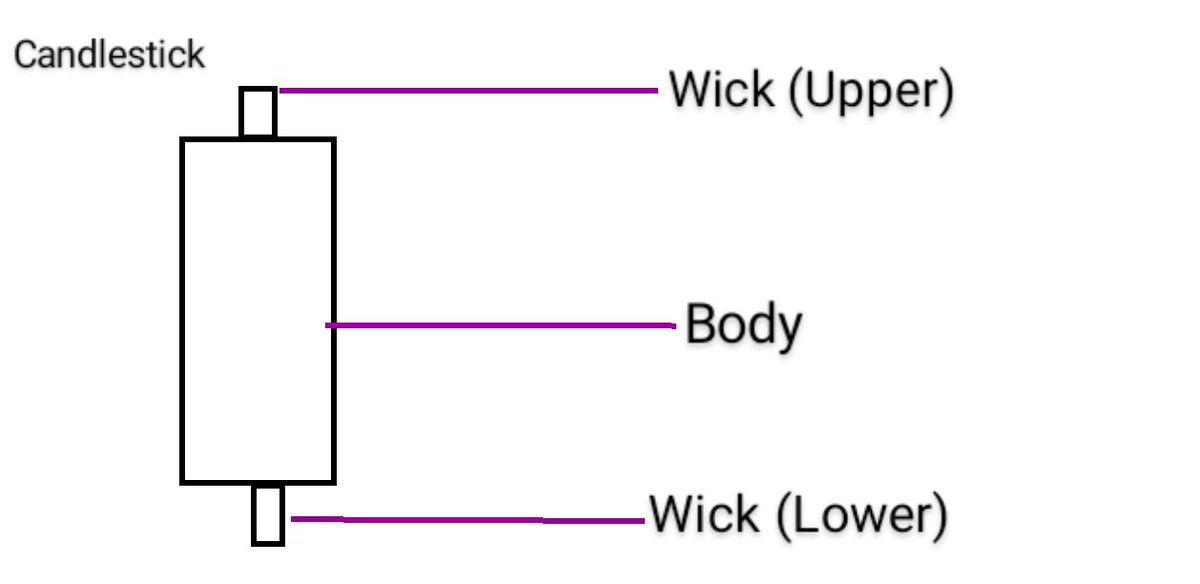
A candlestick is a block that interprets the interaction of price in a certain period or time window or what we simply call a "timeframe" in trading.
A candlestick consists of two parts:-
- Body
- Wicks
And they show these info about price:
- Open
- Close
- High and
- Low.
A candlestick consists of two parts:-
- Body
- Wicks
And they show these info about price:
- Open
- Close
- High and
- Low.
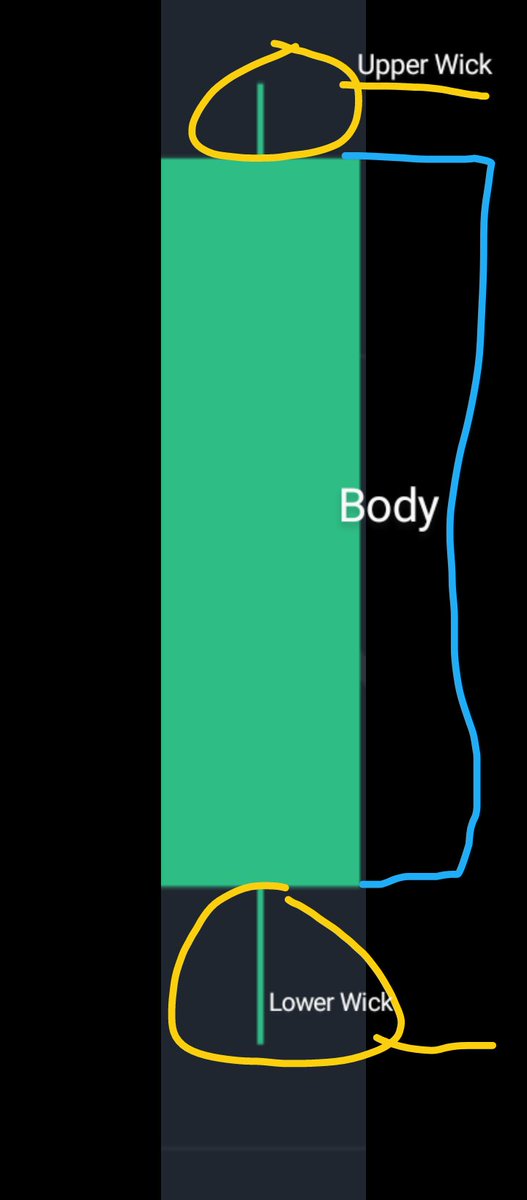
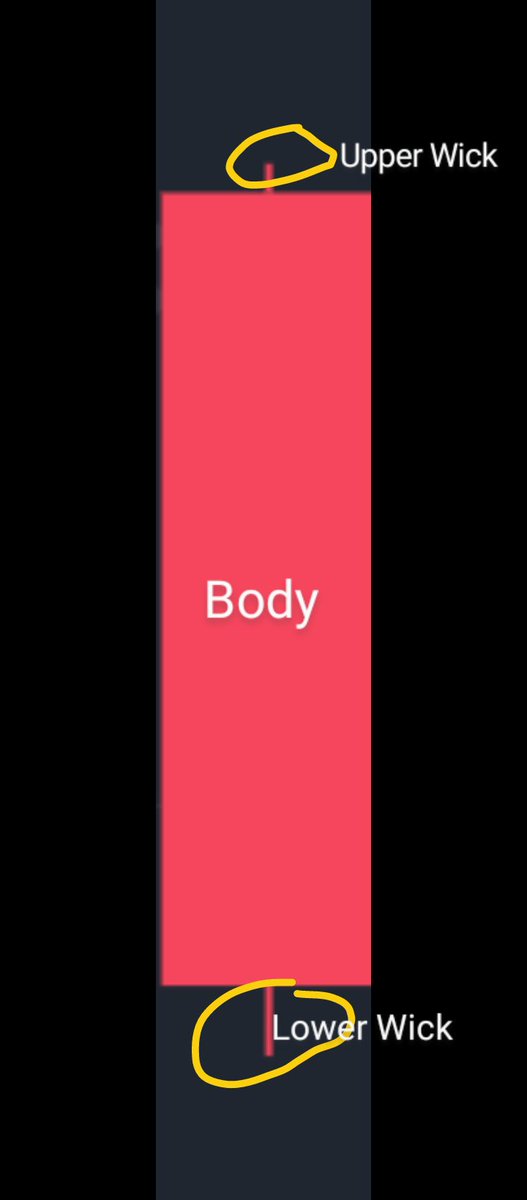
What's a Wick?
A wick is that thin needle-like structure that rests above or below a candle.
While the body of the candle is the thick and solid structure.
A wick is that thin needle-like structure that rests above or below a candle.
While the body of the candle is the thick and solid structure.
Now moving forward to the interpretation of a Candlestick.
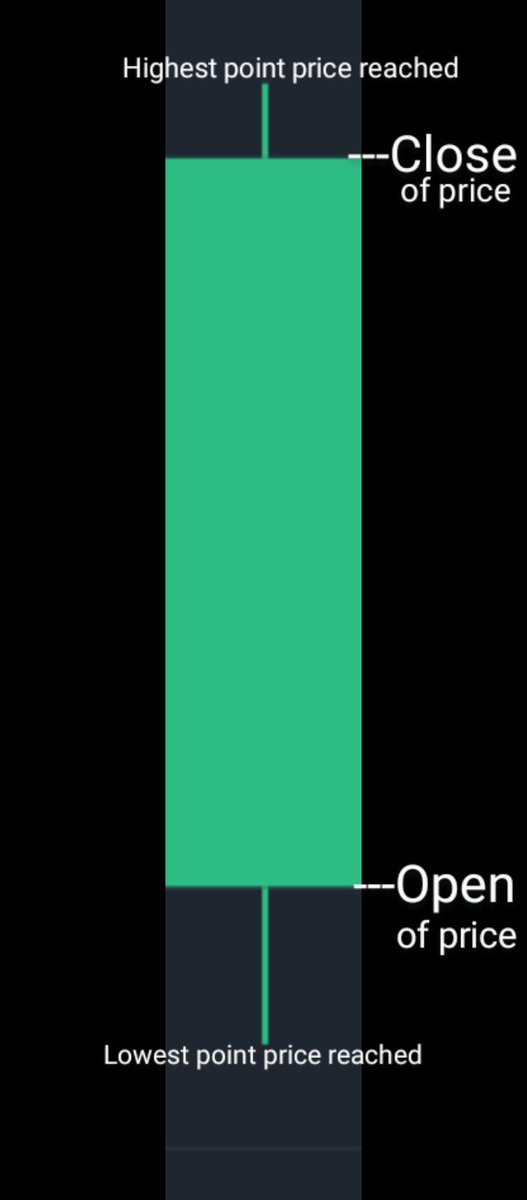
This is a bullish Candlestick symbolized by the green colour.
The "Open" is where the price started from which is the start of the rectangle and the Close is where price ended.
This is a bullish Candlestick symbolized by the green colour.
The "Open" is where the price started from which is the start of the rectangle and the Close is where price ended.
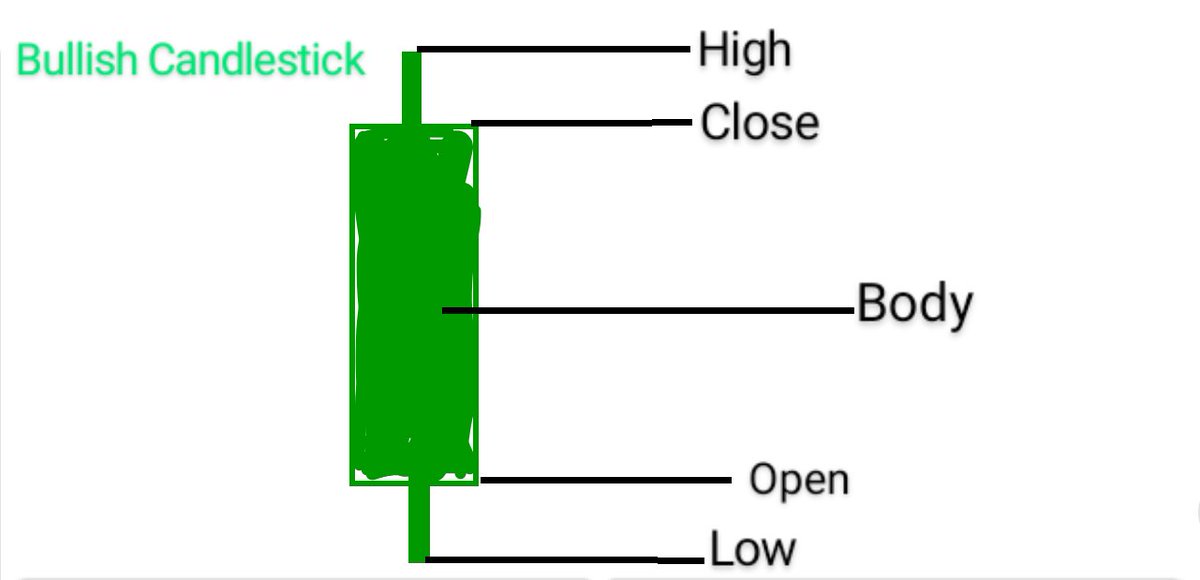
If the close of a Candlestick is higher than the open which you can see in the above image, that means we have a bullish Candlestick.
The "High" is the highest point price got to, while the "Low" is the lowest point price got to in that timeframe.
The "High" is the highest point price got to, while the "Low" is the lowest point price got to in that timeframe.
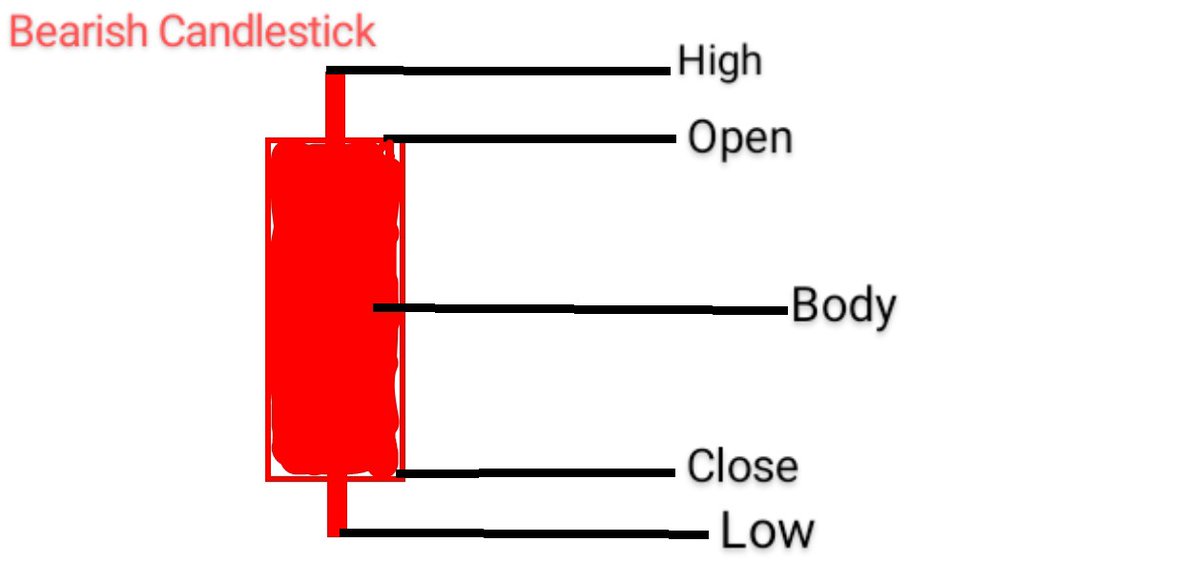
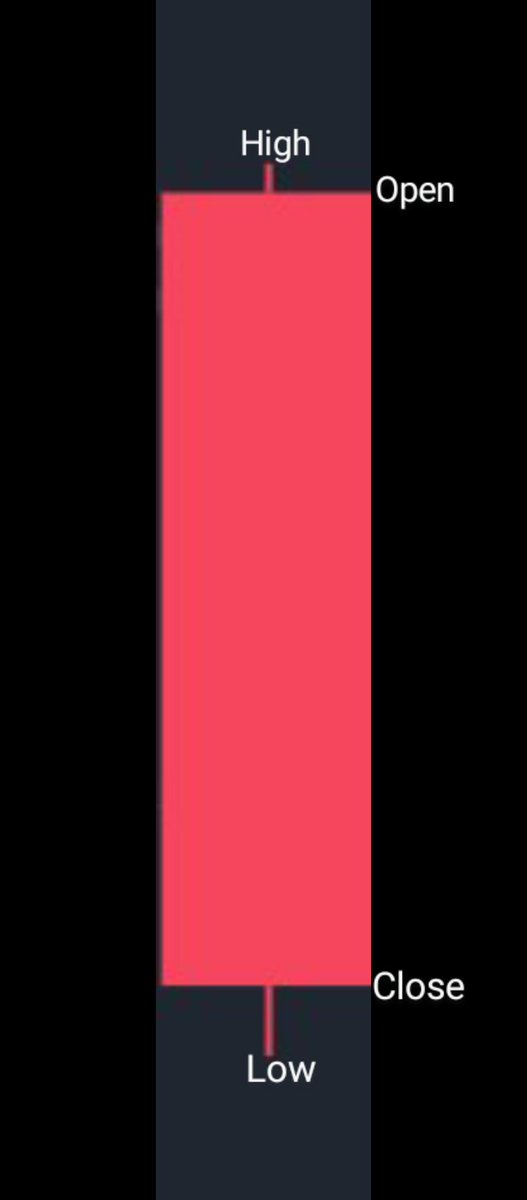
In a bearish Candlestick, just invert the Open and Close of a bullish Candlestick.
That is price opens above but closes below which means a fall in price (shown in red).
The high and lows are the same, that is the highest point price got to and the lowest point price reached.
That is price opens above but closes below which means a fall in price (shown in red).
The high and lows are the same, that is the highest point price got to and the lowest point price reached.

Let's go practical with this.
You can see these Candlesticks on the $BTC chart have the features I talked about which are Wicks and Bodies.
I've chosen two bearish and bullish Candlesticks on this chart to dissect for you.
You can see their features in frame 2 and 3 below.
You can see these Candlesticks on the $BTC chart have the features I talked about which are Wicks and Bodies.
I've chosen two bearish and bullish Candlesticks on this chart to dissect for you.
You can see their features in frame 2 and 3 below.

Now we've identified their structures, how do we interprete them?
Firstly, remember I picked the candle from the Daily Timeframe (1D) that is each candlestick shown represents the movement of price for every 24 hours.
Secondly, the candlestick I chose opened below and closed..
Firstly, remember I picked the candle from the Daily Timeframe (1D) that is each candlestick shown represents the movement of price for every 24 hours.
Secondly, the candlestick I chose opened below and closed..
above which means on the day which the candlestick belongs to, price opened (started) at a low price and the ended at a higher price which means that day was bullish for #BTC.
Press on the candle and hold, a dialogue box at the right will show you the details of price that day.
Press on the candle and hold, a dialogue box at the right will show you the details of price that day.

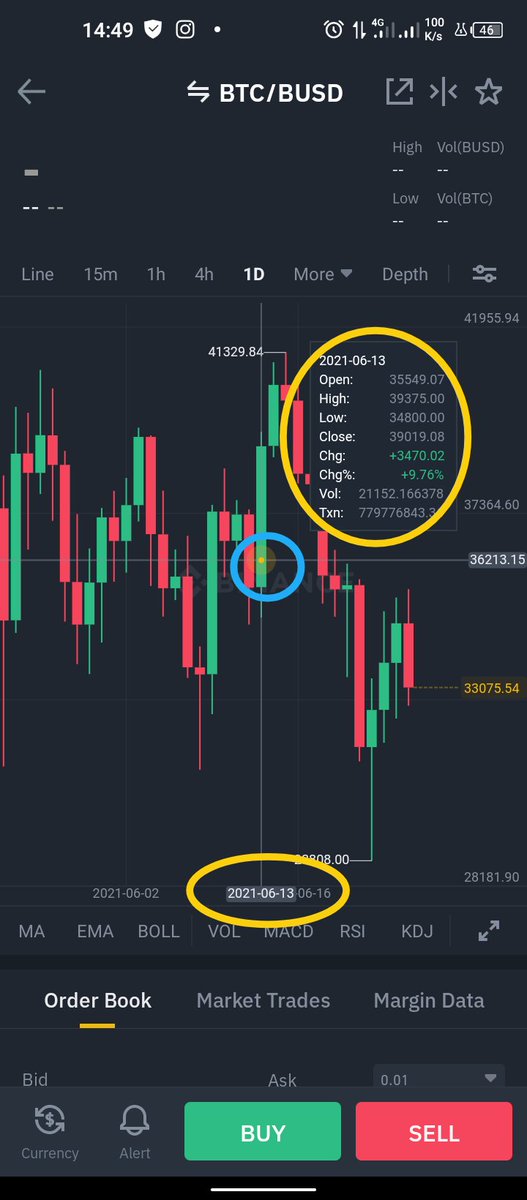
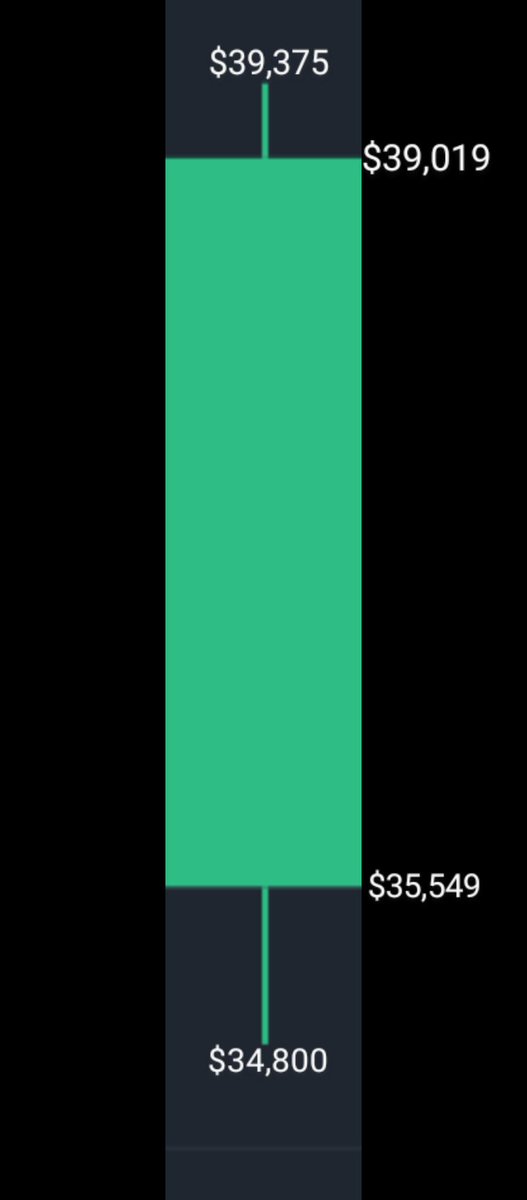
You can see the dialogue box shows the date which is 13/06/2021 and price OPENED or started the day at $35,549, dipped to a LOW of $34,800, and the HIGHEST point price got to was $39,375 and then $BTC CLOSED the day at a price of $39,019.
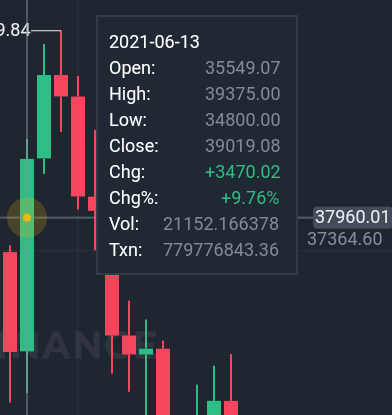
OPEN: $35,509
HIGH: $39,375
LOW: $34,800
CLOSE: $39,019
Now if I input these details above on the candlestick, this is how it will look like.
The most important info we need is the open and close of the day, if the open is $35k and the close is $39k, that means $BTC made a...
HIGH: $39,375
LOW: $34,800
CLOSE: $39,019
Now if I input these details above on the candlestick, this is how it will look like.
The most important info we need is the open and close of the day, if the open is $35k and the close is $39k, that means $BTC made a...

profit of $4k on that day which is why we have a bullish green candle..
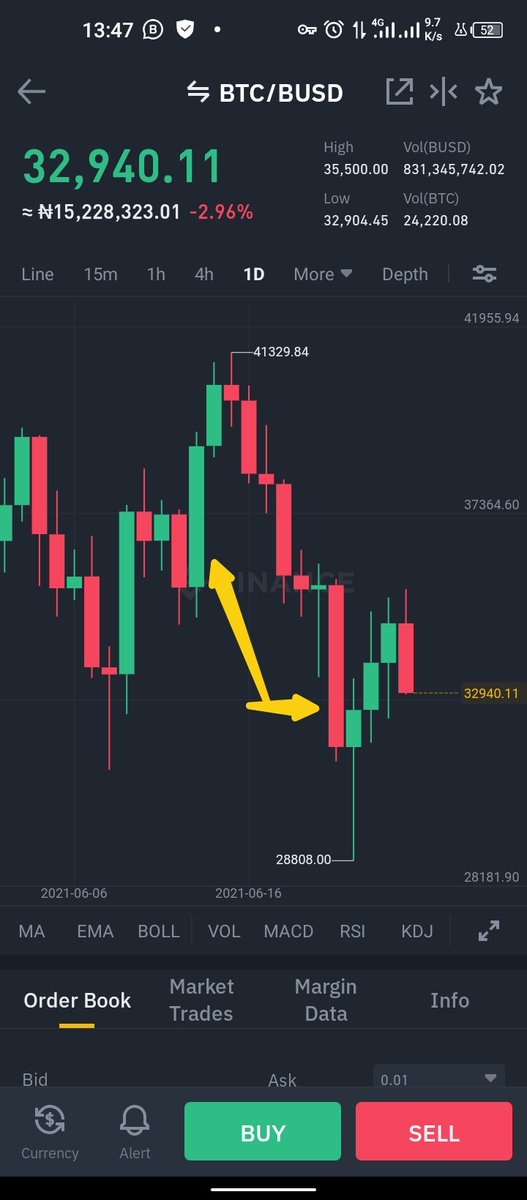
Now let's move to the Bearish Candle, like I said, the features of both bullish and bearish Candlesticks are the same (body & wicks), but the message they pass are different.
Now let's move to the Bearish Candle, like I said, the features of both bullish and bearish Candlesticks are the same (body & wicks), but the message they pass are different.
In a bearish candlestick, the message it passes is that price opens above and closes below.
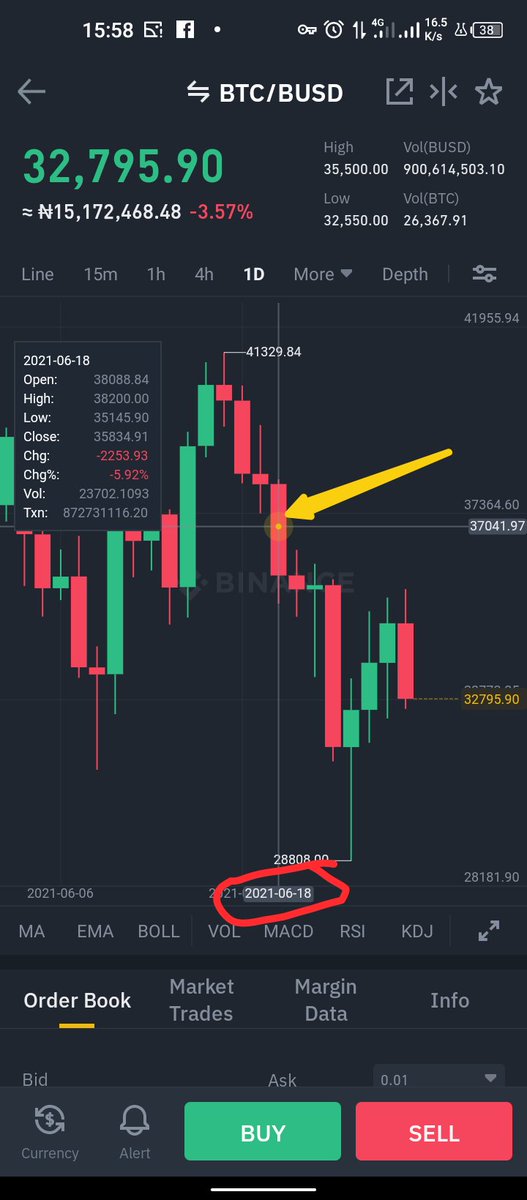
Again, hold and press that candle on your screen to show you the date and the details.
The candle I chose was on 18/06/2021 and the dialogue box that's by the left side tells us...
Again, hold and press that candle on your screen to show you the date and the details.
The candle I chose was on 18/06/2021 and the dialogue box that's by the left side tells us...

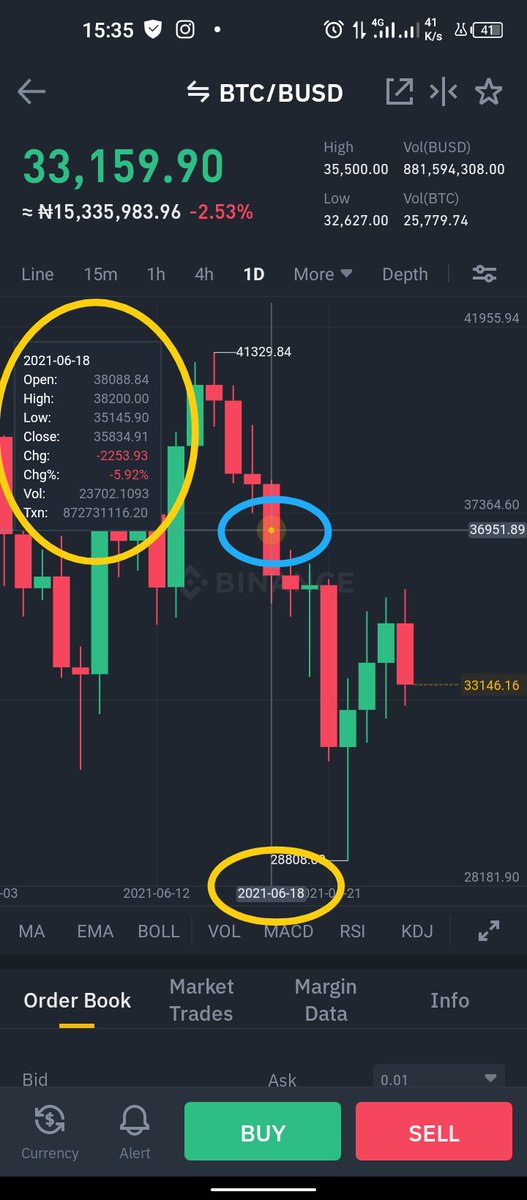
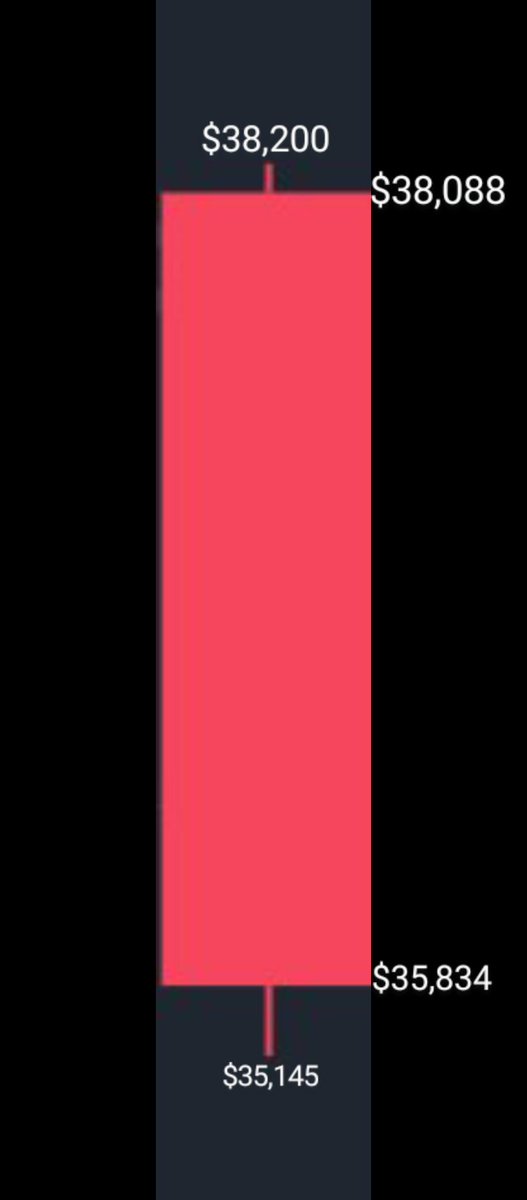
That on the 18th of June 2021, $BTC OPENED at a price of $38,088, dipped to a LOW of $35,145, and the HIGHEST price #BTC got to was $38,200 before CLOSING at a price of $35,834.
OPEN: $38,088
HIGH: $38,200
LOW: $35,145
CLOSE: $35,834.
Let's input these parameters on the candle.
OPEN: $38,088
HIGH: $38,200
LOW: $35,145
CLOSE: $35,834.
Let's input these parameters on the candle.

Now from this thread you've known:
- Types of Trends.
- How to identify trends and markets.
- Types of Candlesticks.
- How to Interprete Candlesticks on Charts.
Congratulations to stepping up in technical analysis.💥😊.
- Types of Trends.
- How to identify trends and markets.
- Types of Candlesticks.
- How to Interprete Candlesticks on Charts.
Congratulations to stepping up in technical analysis.💥😊.
In the next thread I'll be teaching you Support and Resistance and how to place trades based on this strategy.
Follow and Turn on post notifications to get it when it drops.😊
I remain your favorite Cryptocurrency Coach @ThePaulOla
Follow and Turn on post notifications to get it when it drops.😊
I remain your favorite Cryptocurrency Coach @ThePaulOla
If you found value in this thread, kindly RETWEET for others to see.
Here's the beginning of the thread to retweet.
Here's the beginning of the thread to retweet.
And if you're looking for PART 1 of this thread, here it is.
Loading suggestions...