

You've been hearing about Technical Analysis and wanting to know what it is about especially how and when to buy dips using charts.
Technical Analysis is a lot, but I'll make it as simple as possible for newbies in this introductory #thread.
RETWEET for others to learn.🙂🔥
Technical Analysis is a lot, but I'll make it as simple as possible for newbies in this introductory #thread.
RETWEET for others to learn.🙂🔥
Firstly what is Technical Analysis?
Technical Analysis is simply the technique of studying past price action and using that to forecast or predict probable future price movements at certain periods.
That is using history to predict the future.
This is as simple as it can get.
Technical Analysis is simply the technique of studying past price action and using that to forecast or predict probable future price movements at certain periods.
That is using history to predict the future.
This is as simple as it can get.
In Analysis, we have two (main) types of traders:
1) Fundamental Analysts: These type of traders take trades based on "Fundamental analysis", that is factors that influence a cryptocurrency's current situation eg the value and strength, news of new innovations, partners etc.
1) Fundamental Analysts: These type of traders take trades based on "Fundamental analysis", that is factors that influence a cryptocurrency's current situation eg the value and strength, news of new innovations, partners etc.
Fundamental Analysis or "Doing your Research" answers "Why" and "What" and this helps with hints on Cryptos to hodl long term.
2). Technical Analysts: Technical Analysts are simply traders who trade based on previous price action and use that to anticipate future price movements
2). Technical Analysts: Technical Analysts are simply traders who trade based on previous price action and use that to anticipate future price movements
Know that past price action is studied using charts.
Now you may feel scared at this point and think studying the charts is not for you and you'd rather stick to fundamental analysis.
Lol, you may be right, it's not compulsory to trade technically but it's necessary to have at
Now you may feel scared at this point and think studying the charts is not for you and you'd rather stick to fundamental analysis.
Lol, you may be right, it's not compulsory to trade technically but it's necessary to have at
least a basic knowledge about technical analysis as a trader.
Understanding the charts on a basic level is "simple but not easy" because it takes a lot of time and mental strength, trading itself is psychological hence you need to be prepared for the tests, but if you devote
Understanding the charts on a basic level is "simple but not easy" because it takes a lot of time and mental strength, trading itself is psychological hence you need to be prepared for the tests, but if you devote
yourself to learning it, you'll know and understand it.
I'll advice you treat this thread as a very serious lecture and have an open heart to understanding technical analysis, don't think you "may" not understand it, have a positive mindset that you just won't know this...
I'll advice you treat this thread as a very serious lecture and have an open heart to understanding technical analysis, don't think you "may" not understand it, have a positive mindset that you just won't know this...
But you WILL also understand it..
Fundamental analysis and Technical analysis are complementary hence they are important to your success as a trader because if you buy a Cryptocurrency based on your Fundamental Analysis, how would you know when to sell? This is the issue as most
Fundamental analysis and Technical analysis are complementary hence they are important to your success as a trader because if you buy a Cryptocurrency based on your Fundamental Analysis, how would you know when to sell? This is the issue as most
Traders don't know when to sell or take profits and this is why traders let their profits run into losses.
This is a reason why Technical Analysis (TA) is important because it tells you "When" to take trading decisions.
This is a reason why Technical Analysis (TA) is important because it tells you "When" to take trading decisions.
The first thing you need to know about Technical Analysis is "Market Structure"
What is Market Structure?
Market Structure is simply the current situation or trend of price, that is "is the current direction of price bullish (upward trend)? or bearish (downward trend)?"
What is Market Structure?
Market Structure is simply the current situation or trend of price, that is "is the current direction of price bullish (upward trend)? or bearish (downward trend)?"
Now what is a trend? A trend is simply defined as the constant movement of price in a certain direction.
Now I'll make use of images here for you to understand this easily (Excuse the bad drawing lol, but learn from it)
Now I'll make use of images here for you to understand this easily (Excuse the bad drawing lol, but learn from it)
Example.
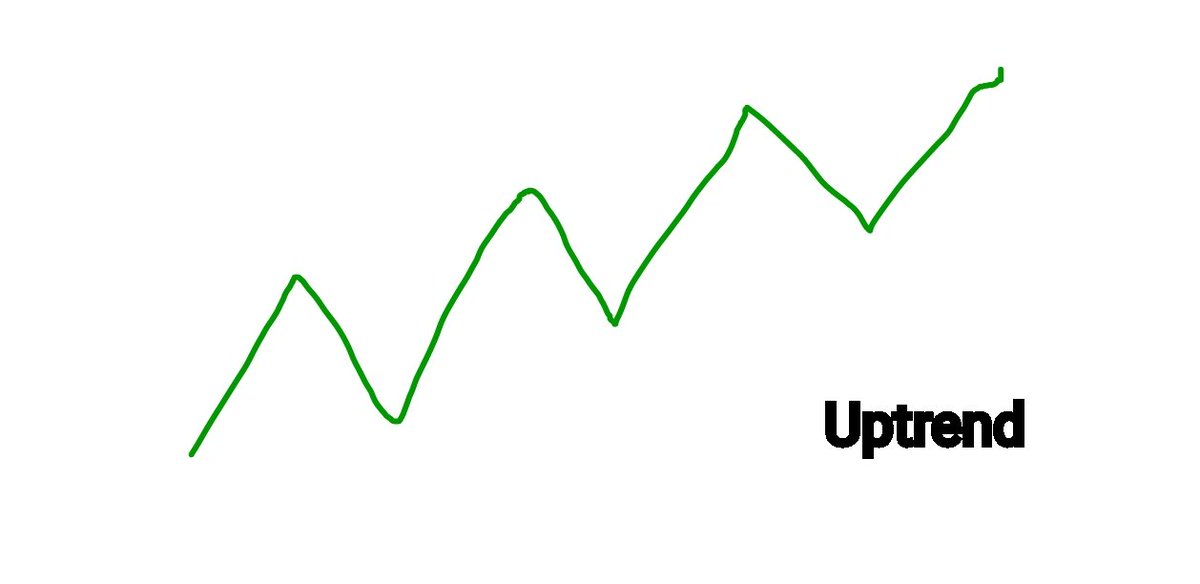
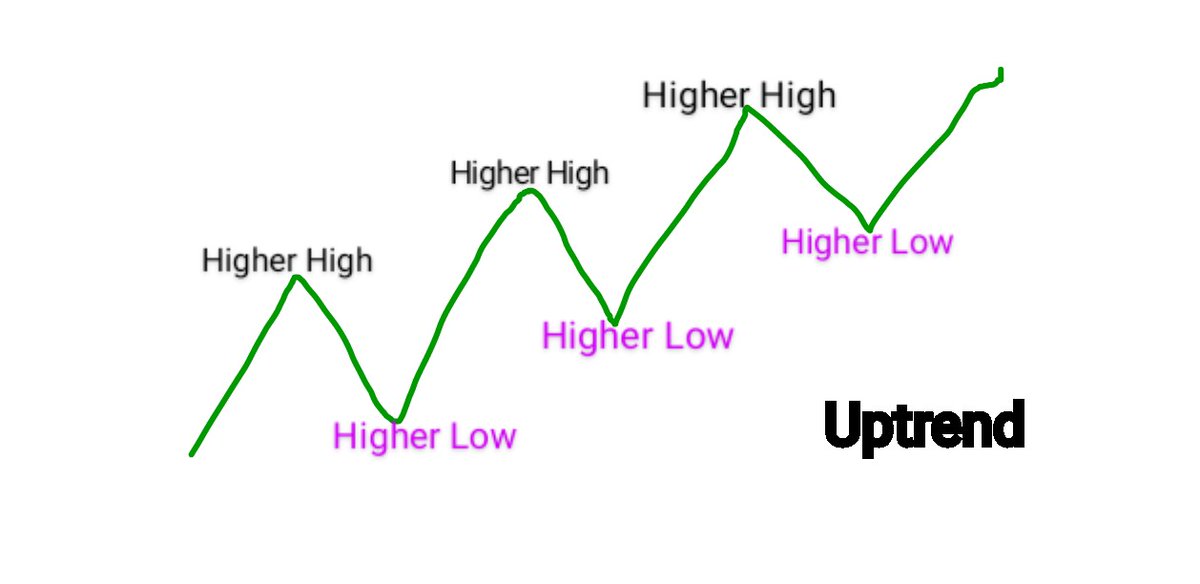
The market structure in Frame 1 is bullish.
Why?
It's simply because it's in an uptrend as you can see price move in a constant upward direction.
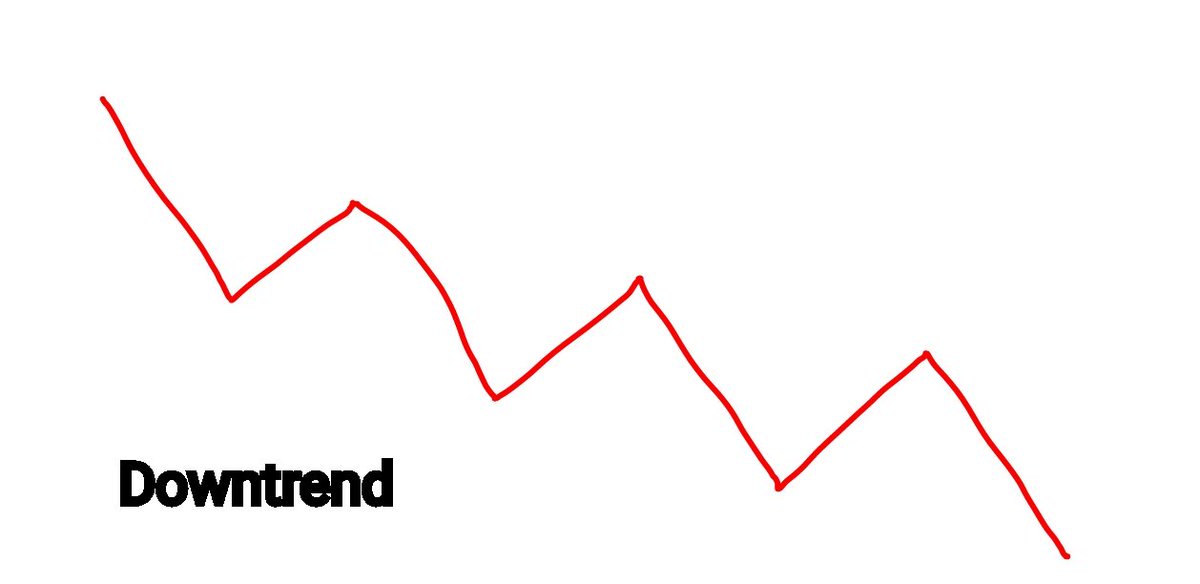
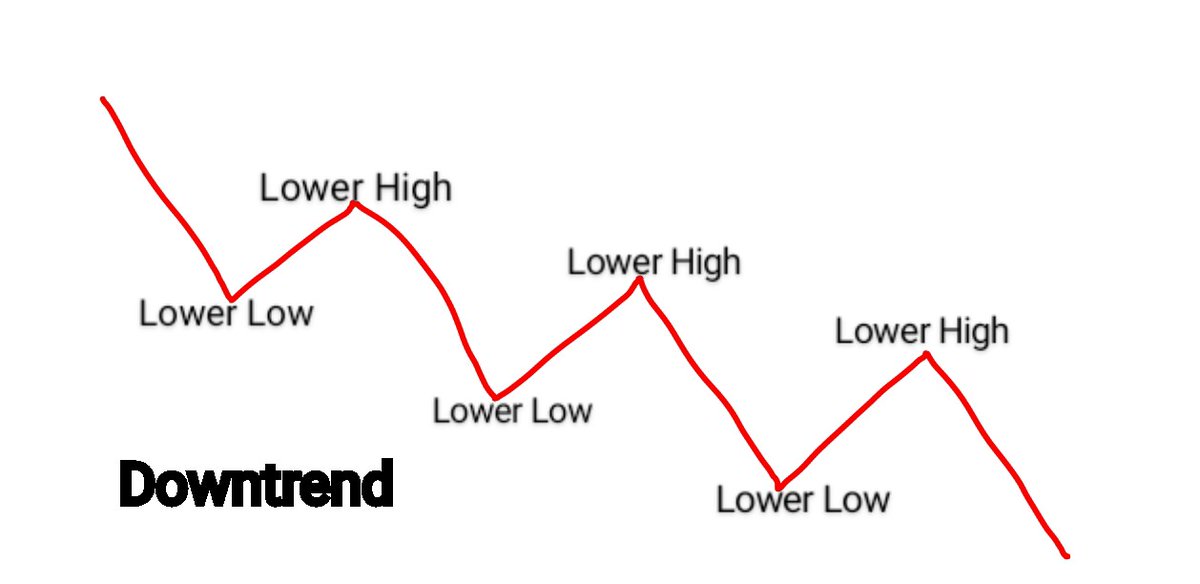
While Frame 2 is bearish.
Why?
You can see price in a downtrend because it's moving in a constant downward direction.
The market structure in Frame 1 is bullish.
Why?
It's simply because it's in an uptrend as you can see price move in a constant upward direction.
While Frame 2 is bearish.
Why?
You can see price in a downtrend because it's moving in a constant downward direction.
Now here's where I need to explain basic price action to you, you see in these images there opposite movements despite maintaining a constant direction right?
ie. in the bullish image where price was going up, you can see we had price fall a bit before going up.
ie. in the bullish image where price was going up, you can see we had price fall a bit before going up.
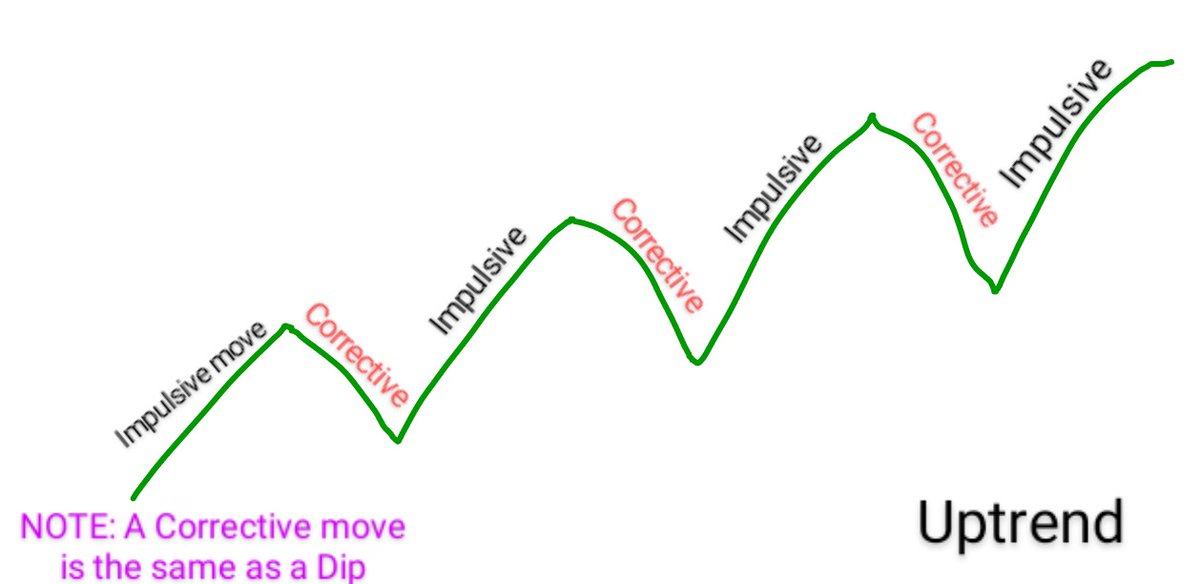
That slight fall is what we can call a retracement/bearish move/corrective move/pullback or what you simply know as a "dip".
While the upward move is called a rally/ bullish move/impulsive move or what you know as a "pump".
See the image below for a graphical illustration.
While the upward move is called a rally/ bullish move/impulsive move or what you know as a "pump".
See the image below for a graphical illustration.
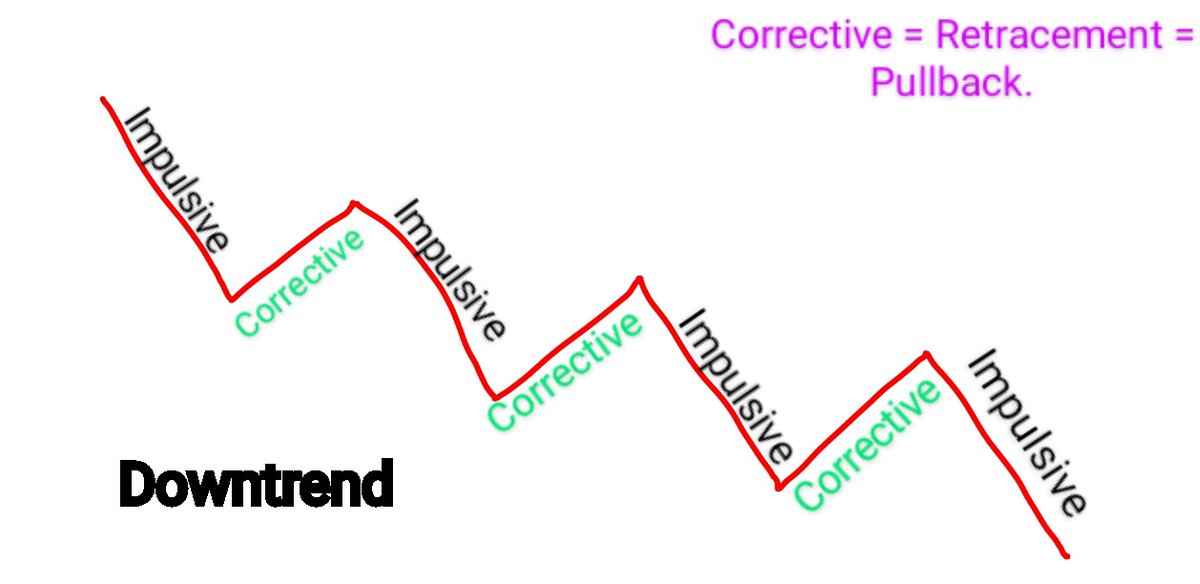
The same thing can also be inverted in a downtrend or bearish structure just as shown in this image.
The slight upward move is a retracement/corrective move just as explained above, and the further move downward is called an impulsive move or "dip".
The slight upward move is a retracement/corrective move just as explained above, and the further move downward is called an impulsive move or "dip".
HOW TO IDENTIFY TRENDS
Now let's go deeper.
Each trend is made of Highs and Lows
In a bullish trend or Uptrend, price makes "Higher Highs" and "Higher Lows" & this is "WHEN" you buy a Cryptocurrency mostly in their dips because price moves up.
See image below for explanation
Now let's go deeper.
Each trend is made of Highs and Lows
In a bullish trend or Uptrend, price makes "Higher Highs" and "Higher Lows" & this is "WHEN" you buy a Cryptocurrency mostly in their dips because price moves up.
See image below for explanation
While in a bearish trend or downtrend, price falls hence it makes "Lower Highs" and "Lower Lows" and this is when you sell your Cryptocurrency because price moves "Down", the earlier you sell, the profitable you are.
The image below also explains that perfectly.
The image below also explains that perfectly.
Now one important thing you need to know is that "The trend does not continue forever".
If the trend of a Cryptocurrency (especially a solid one) is bullish, it won't continue going up forever, it would definitely change to a bearish/downward trend too after a while and this is
If the trend of a Cryptocurrency (especially a solid one) is bullish, it won't continue going up forever, it would definitely change to a bearish/downward trend too after a while and this is
a reason why you need to take profits on trades and close your trades early when you're in a loss because the trend changes frequently.
A change in trend occurs when price simply does the opposite action of what it's done for a while.
Here's an illustration of a change in trend
A change in trend occurs when price simply does the opposite action of what it's done for a while.
Here's an illustration of a change in trend
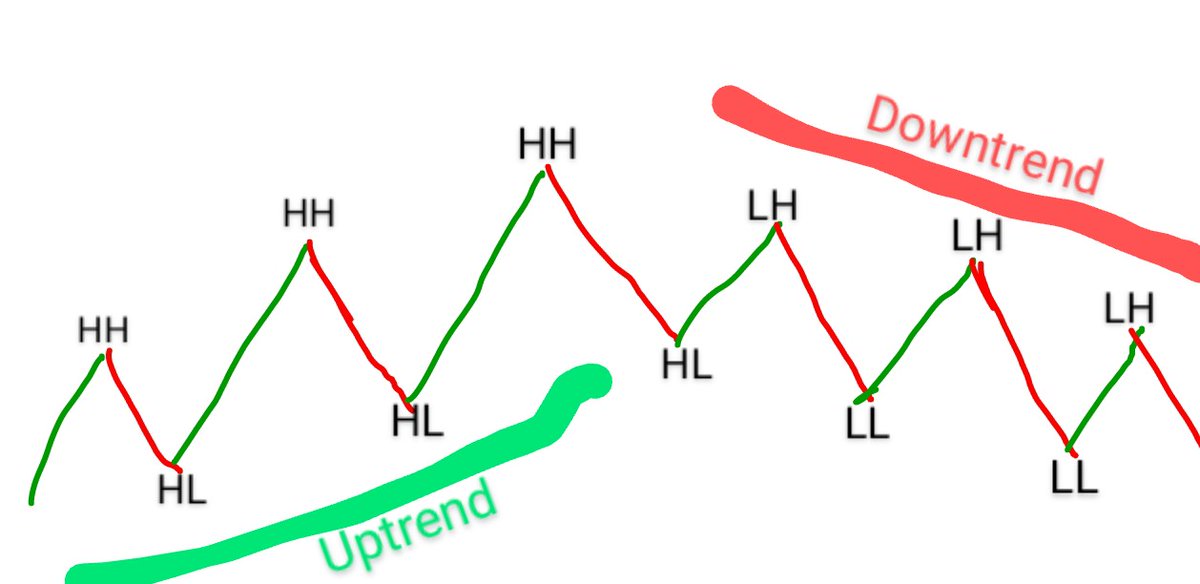
HH - Higher High
HL - Higher Low
LH - Lower High
LL - Lower Low.
You can see price was previously making higher highs and higher lows, but later failed to go higher than the previous higher high, hence that gave us a Lower high because that high was low compared to the past one.
HL - Higher Low
LH - Lower High
LL - Lower Low.
You can see price was previously making higher highs and higher lows, but later failed to go higher than the previous higher high, hence that gave us a Lower high because that high was low compared to the past one.
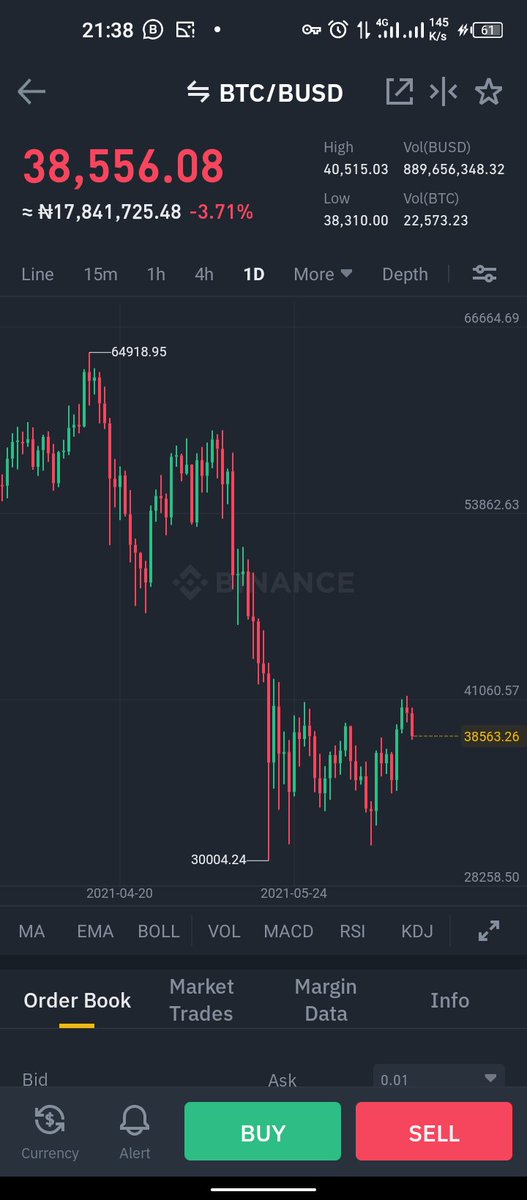
Now let's make a trend analysis using Binance.
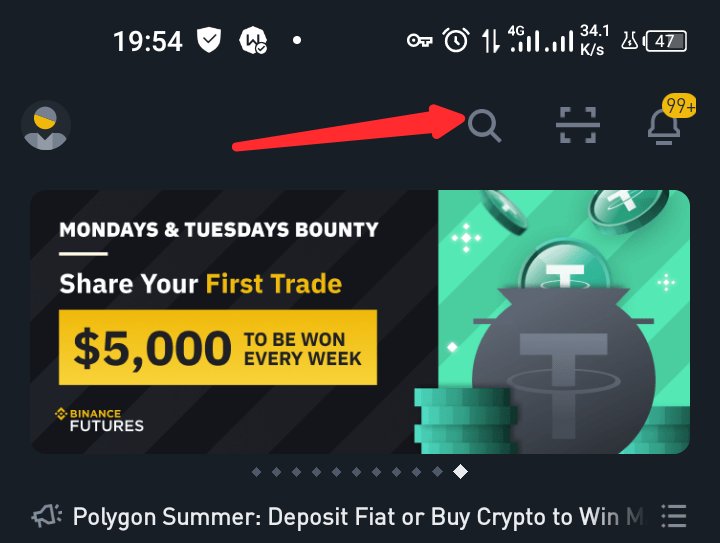
Open the App.
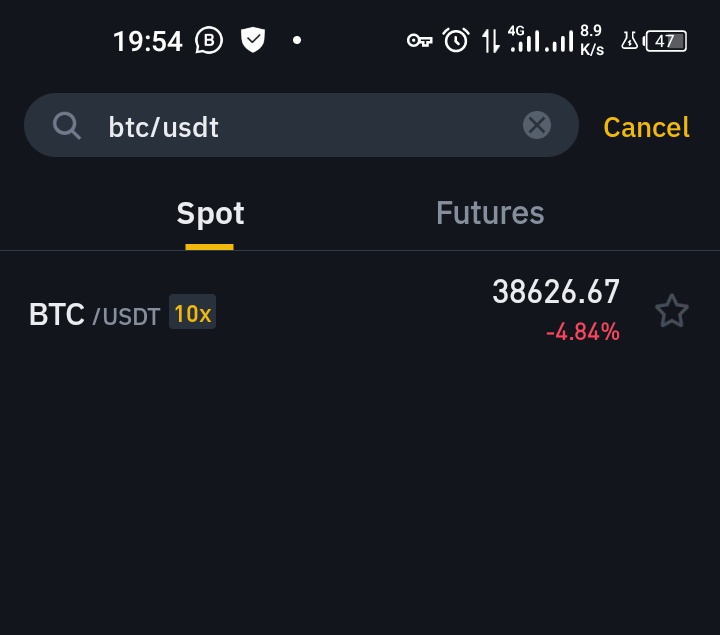
We'd be making our analysis on #Bitcoin click on the BTC/BUSD pair on the homepage or search for BTC/USDT, they're stablecoins pegged to the Dollar so we're basically making our analysis on Bitcoin and the US Dollar.
Open the App.
We'd be making our analysis on #Bitcoin click on the BTC/BUSD pair on the homepage or search for BTC/USDT, they're stablecoins pegged to the Dollar so we're basically making our analysis on Bitcoin and the US Dollar.
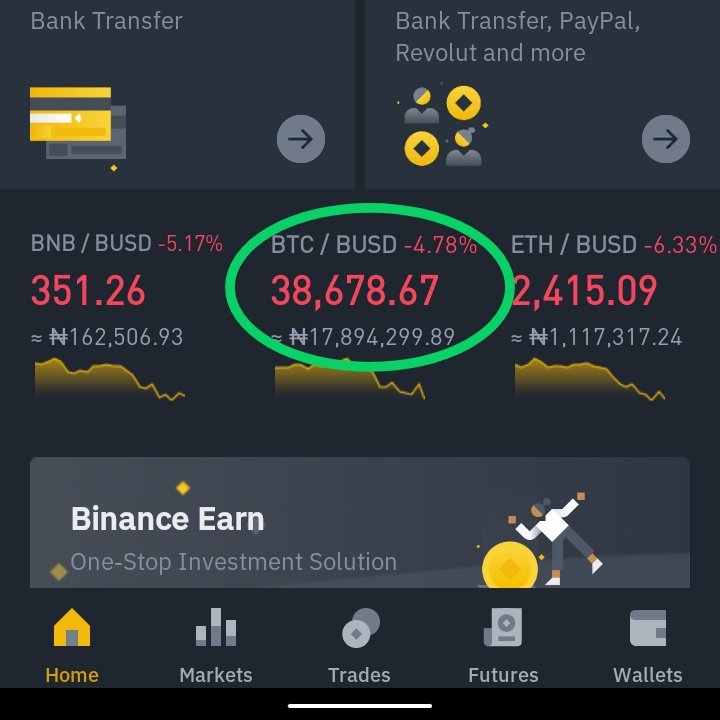
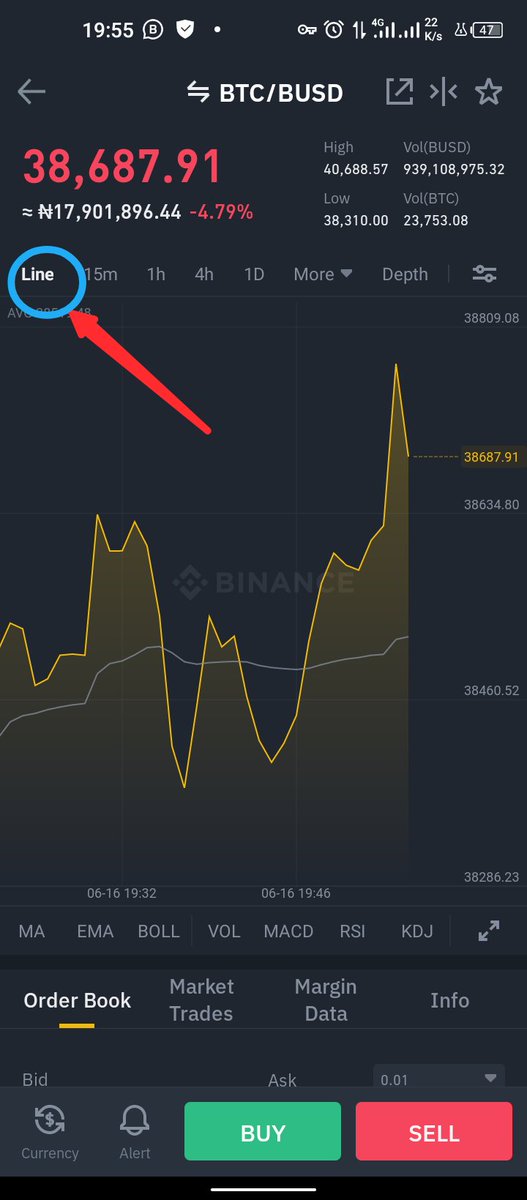
In the next page, you'll be shown the current price of #BTC on a "Line Chart" which is currently $38.6k. but we won't making our analysis on that, we'd be using a "Candlestick Chart".
To change to that, Click on 1D as you can see circled in frame 2 and you'd see the change.
To change to that, Click on 1D as you can see circled in frame 2 and you'd see the change.
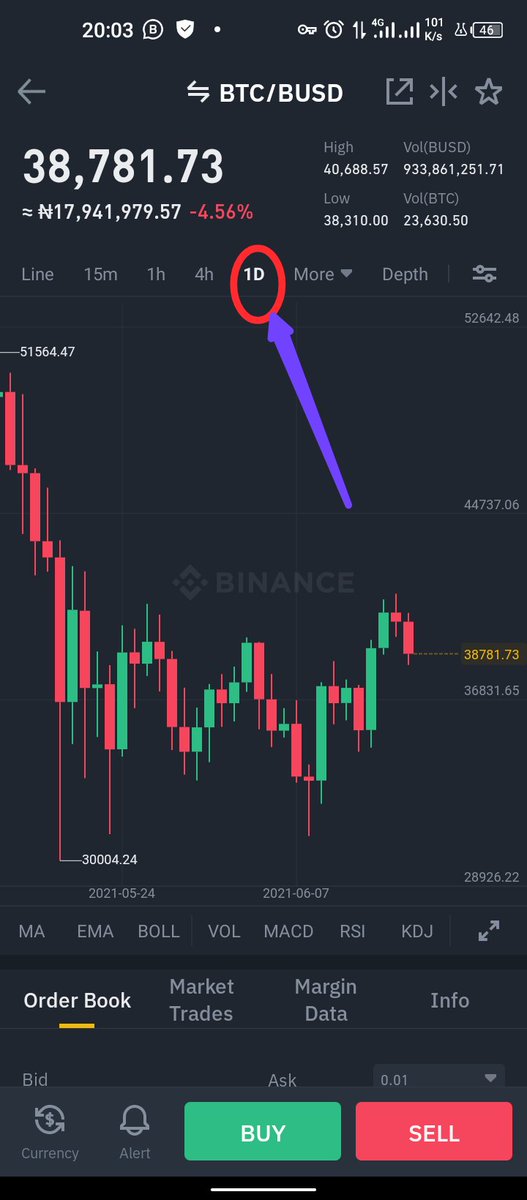
You have a Candlestick Chart displayed and you can checkout past price action by either zooming out or moving the chart to the right by swiping it.
Note: These symbols you see in red and green are called "Candlesticks" and they display the interaction and history of price.
Note: These symbols you see in red and green are called "Candlesticks" and they display the interaction and history of price.
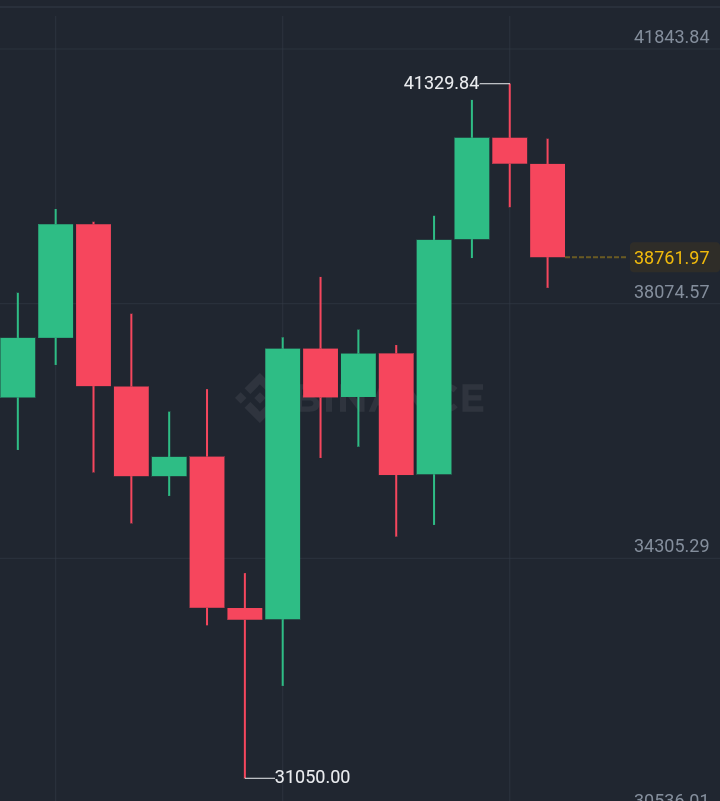
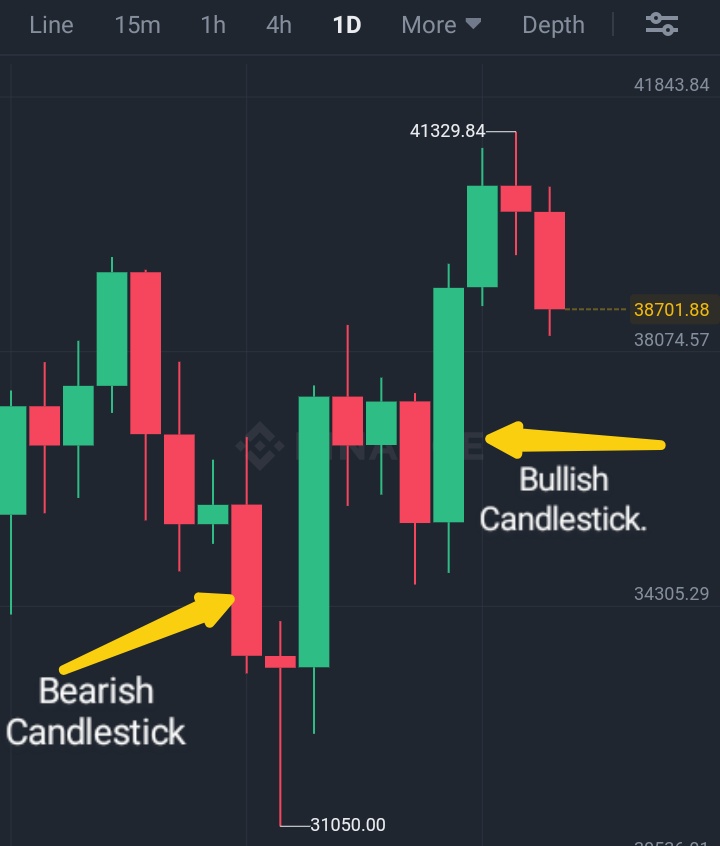
Remember we talked about Bullish and Bearish moves right?
A Bullish move is an upward move displayed in a green candle while a Bearish move is a downward move, and you can also see that displayed in a red candle on the chart, the color scheme makes this easy to understand.
A Bullish move is an upward move displayed in a green candle while a Bearish move is a downward move, and you can also see that displayed in a red candle on the chart, the color scheme makes this easy to understand.
Remember technical analysis is all about price action and the actions you see on the charts are battles between buyers/bulls and sellers/bears.
More Buyers in a market = Bullish Move = Market moves up (green).
More Sellers in a market = Bearish Move = Market goes down (red).
More Buyers in a market = Bullish Move = Market moves up (green).
More Sellers in a market = Bearish Move = Market goes down (red).
On your Chart, zoom out like a picture to have a farther view of price.
To simplify things for you, I've identified these key points in an easy way for you to spot on #BTC on your chart
You can see the huge bearish move,📉that was weeks ago when BTC fell and the trend changed.
To simplify things for you, I've identified these key points in an easy way for you to spot on #BTC on your chart
You can see the huge bearish move,📉that was weeks ago when BTC fell and the trend changed.
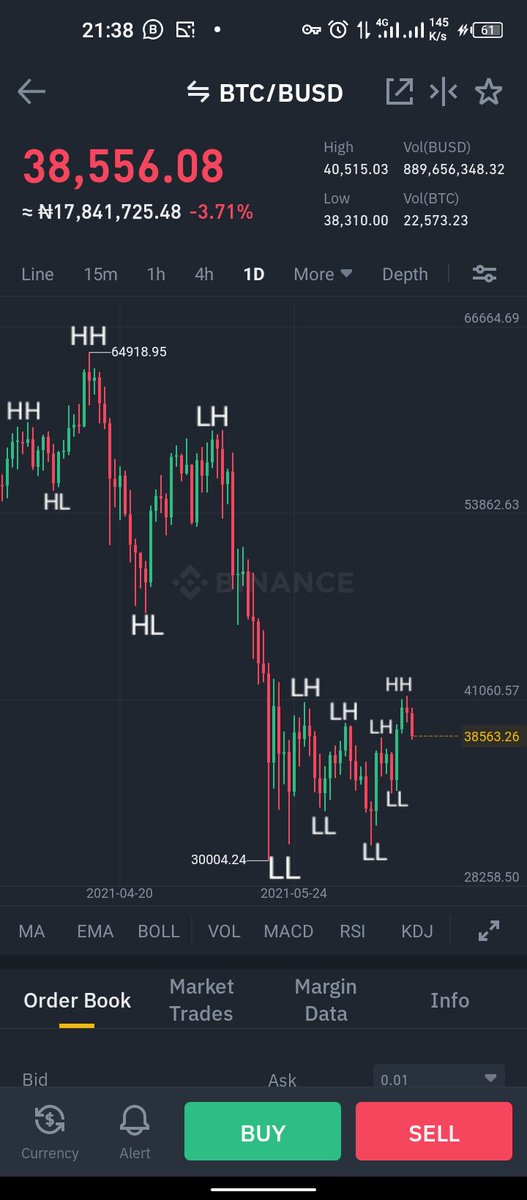
You see we have more of reds than greens and price has made more lows than highs, that shows us we're in a bearish trend, but if you look at the last point, you'll see we now have a higher high because price went higher than the last lower high, this is a change in trend which
you can also call a "Break in market Structure" because the trend changed at that point, but we can't confirm it fully yet until price makes a higher low and then another "Higher High", that would be a signal that BTC is bullish again.
Now it's time to explain timeframes.
Now it's time to explain timeframes.
Each timeframe (TF) is an indication of how price interacted within that certain period.
E.g A daily timeframe (1D) like we used shows you the results of price on a daily level, a 4H timeframe shows you how price interacts every 4 hours, same with 1H, 30M (30 minutes) etc.
E.g A daily timeframe (1D) like we used shows you the results of price on a daily level, a 4H timeframe shows you how price interacts every 4 hours, same with 1H, 30M (30 minutes) etc.
Now let's go to a lower timeframe to check the trend.
We'll choose the 4 hour timeframe to see how price interacted every past 4 hours.
Click on 4H and you can see we have a clearer view of price action on this level, and I've also highlighted price movement for easy spotting.
We'll choose the 4 hour timeframe to see how price interacted every past 4 hours.
Click on 4H and you can see we have a clearer view of price action on this level, and I've also highlighted price movement for easy spotting.
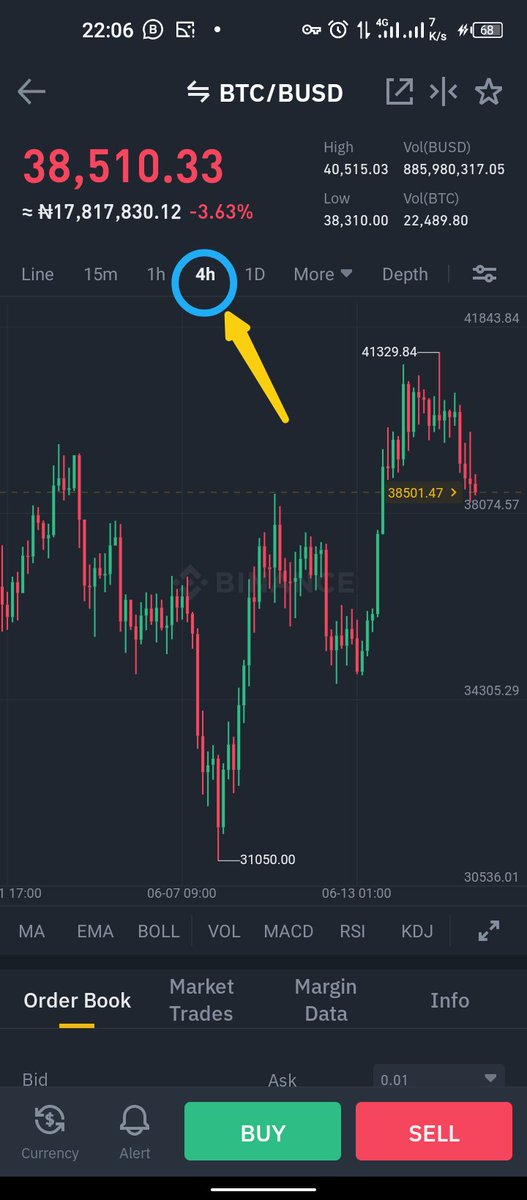

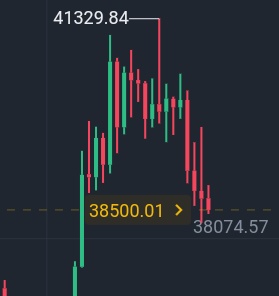
Now based on the 4H timeframe, we can see #BTC is currently making a retracement and if we're going to have a confirmation of a change in trend, it would have to complete that dip as a Higher Low and then pump or have another impulsive move that would give it a Higher High.
This can guide us in our trading decision because we see how price gets displayed on the highs and lows of each candle and even the current candle movement which is $38,500.01 in this image.
Also note that the longer the candlestick, the more intense the trading pressure is.
Also note that the longer the candlestick, the more intense the trading pressure is.
Now that you can identify a bullish trend from a bearish trend, you're beginning to understand TA, and I'd want you to take this as an exercise and assignment.
1). Write down a list of Cryptocurrency pairs you like.
2). Identify their trend.
3). Spot their levels (HH,HL etc)
1). Write down a list of Cryptocurrency pairs you like.
2). Identify their trend.
3). Spot their levels (HH,HL etc)
Do this over the next few days, take this upon yourself seriously, doing this alone will give you an edge over the average trader and you'll thank me later.
Remember this is just an introductory lecture to technical Analysis, in the next thread I'll explain more on Candlesticks.
Remember this is just an introductory lecture to technical Analysis, in the next thread I'll explain more on Candlesticks.
I do hope you found value in this thread, if you did kindly tag a friend and RETWEET for others to see.
And if you have any questions, don't hesitate to ask in the comments. I'll reply you.
See you in the next thread....
I remain your fav Crypto coach & educator @ThePaulOla 🙂
And if you have any questions, don't hesitate to ask in the comments. I'll reply you.
See you in the next thread....
I remain your fav Crypto coach & educator @ThePaulOla 🙂
Here's the beginning of the thread in case you want to retweet.
@threader_app compile
Beginning of thread for RETWEET.
Loading suggestions...