

#Heatmaps thread
In this thread I will explain what are heatmaps, how do they work, how I use them to have edge and what is the current market situation based on this.
Many people ask me when I post a heatmap, so this should be useful for many.
Let's start 👊
1/n
In this thread I will explain what are heatmaps, how do they work, how I use them to have edge and what is the current market situation based on this.
Many people ask me when I post a heatmap, so this should be useful for many.
Let's start 👊
1/n
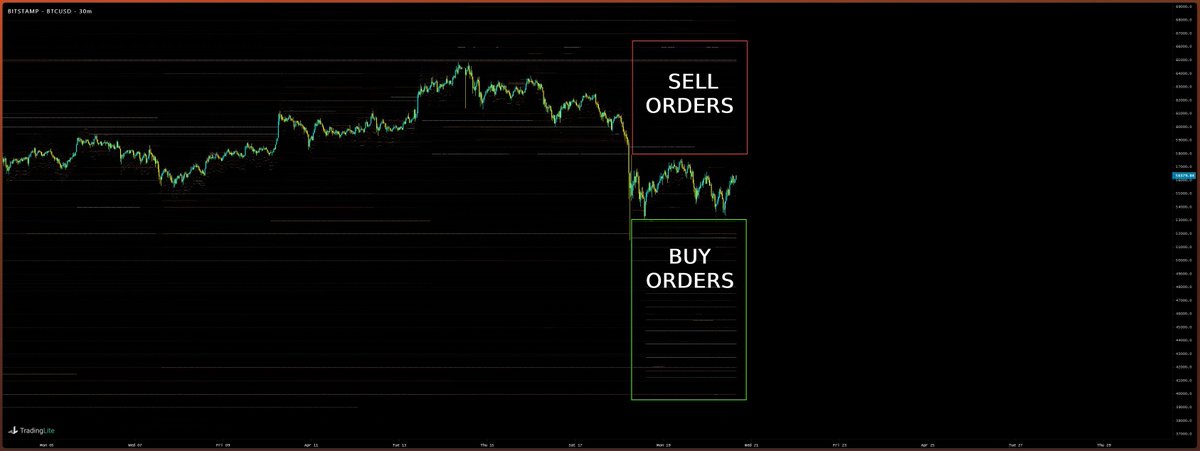
What is a #heatmap?
A heatmap shows the historical liquidity.
Blocks below current price are limit buy orders.
Blocks above current price are limit sell orders.
When the color is more intense, the order is bigger.
tradinglite.com
2/n
A heatmap shows the historical liquidity.
Blocks below current price are limit buy orders.
Blocks above current price are limit sell orders.
When the color is more intense, the order is bigger.
tradinglite.com
2/n
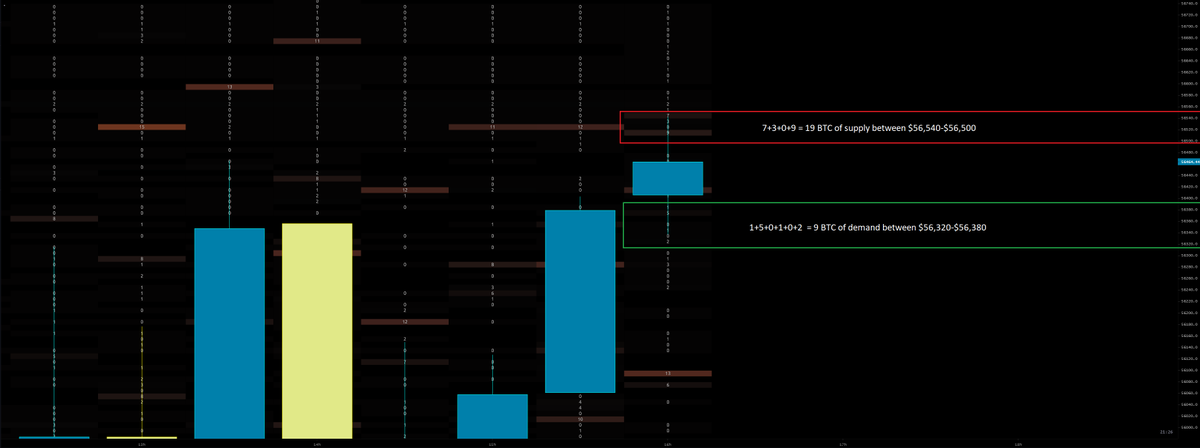
Basically, it shows the current demand and supply on a certain exchange.
If you zoom in or use the ''Heatmap Lens'' tool you can see it with more detail.
3/n
If you zoom in or use the ''Heatmap Lens'' tool you can see it with more detail.
3/n
How I use heatmaps?
First, I try to look for situations where one side is much stronger than the other (demand > supply or supply < demand)
For this I check several of the important exchanges to have a general view.
4/n
First, I try to look for situations where one side is much stronger than the other (demand > supply or supply < demand)
For this I check several of the important exchanges to have a general view.
4/n
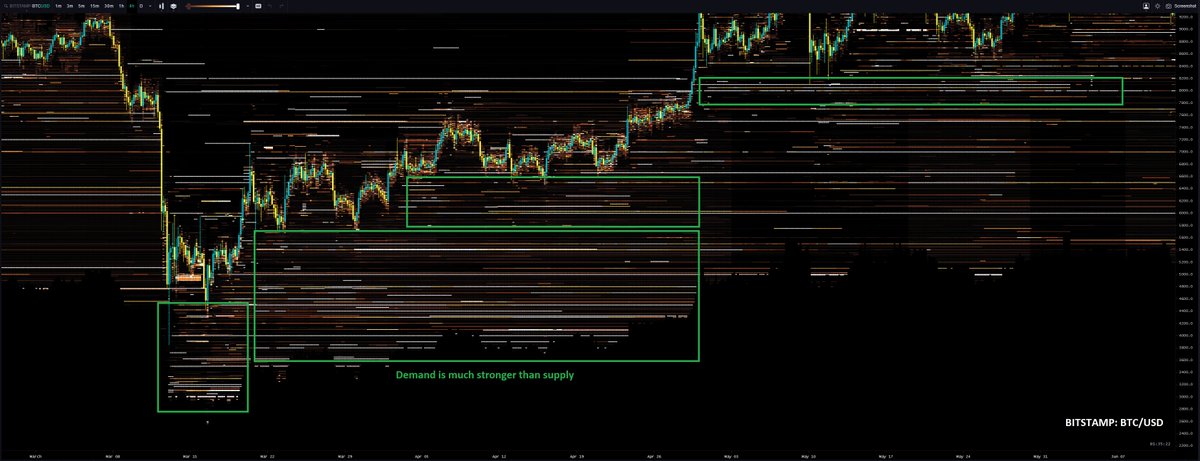
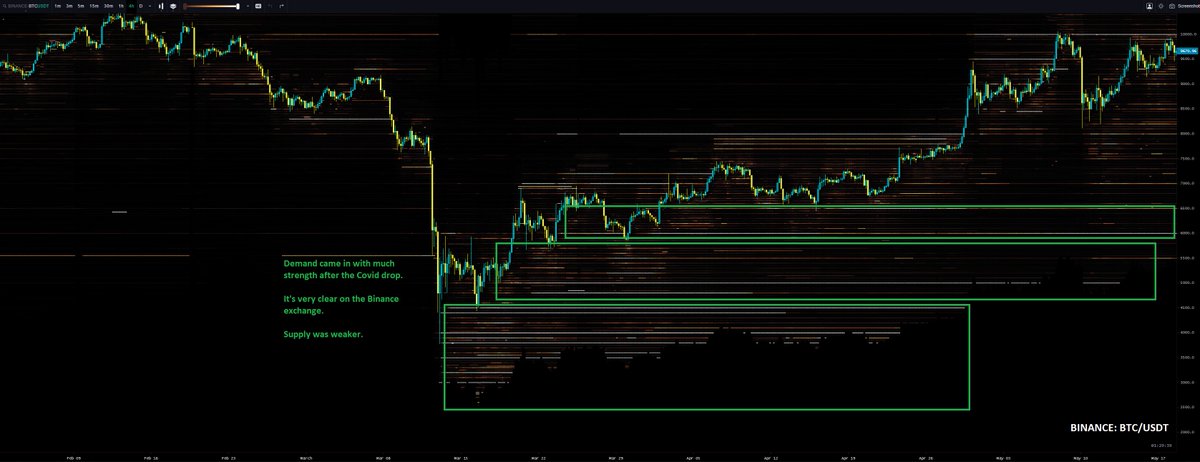
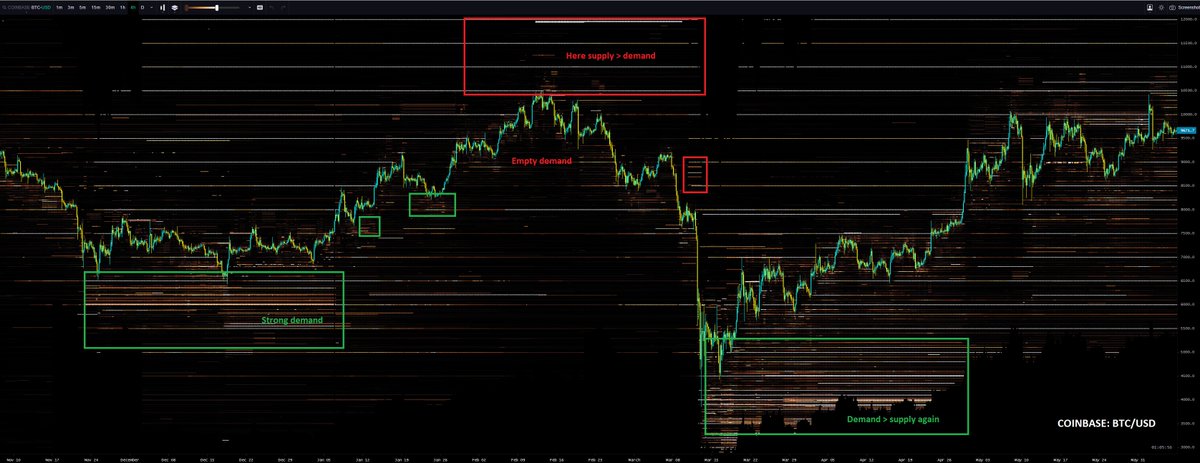
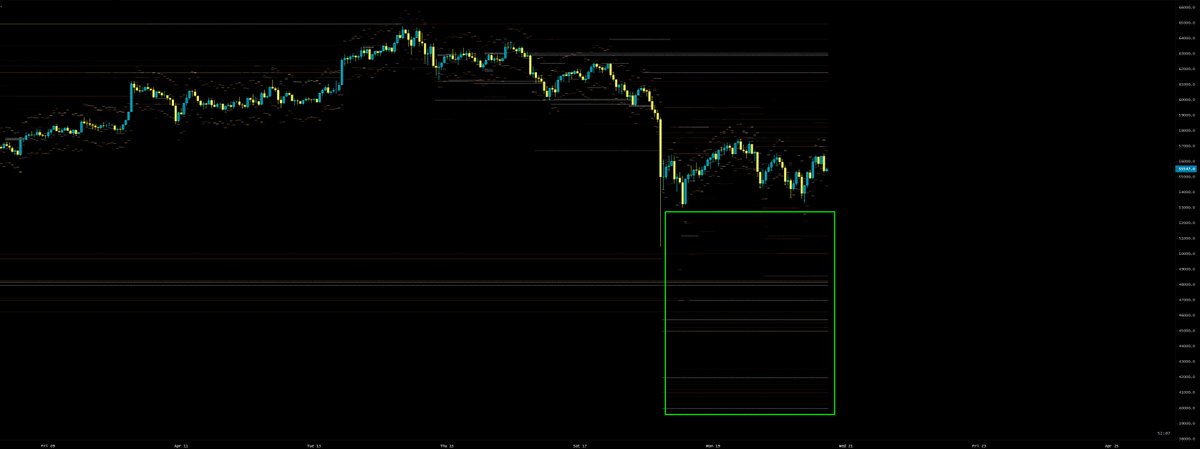
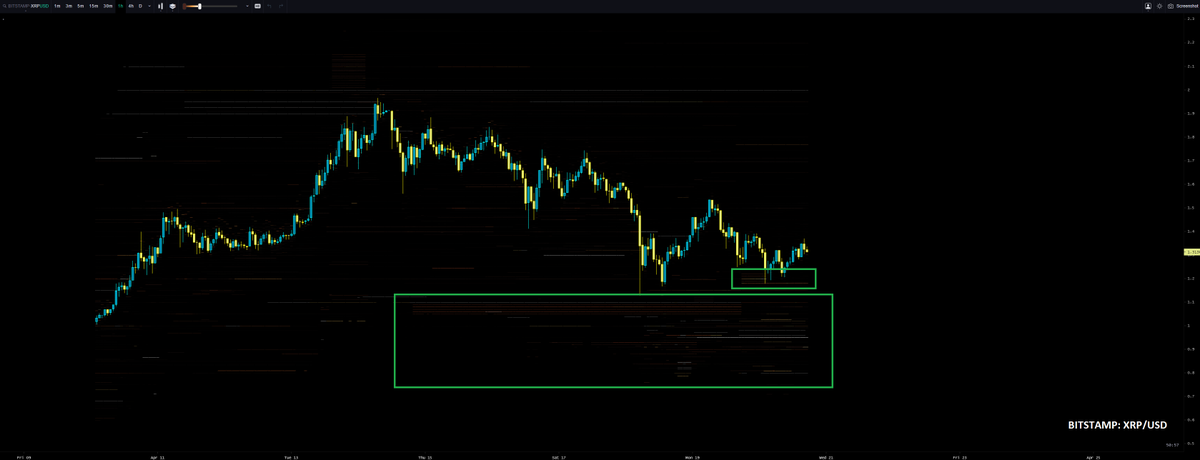
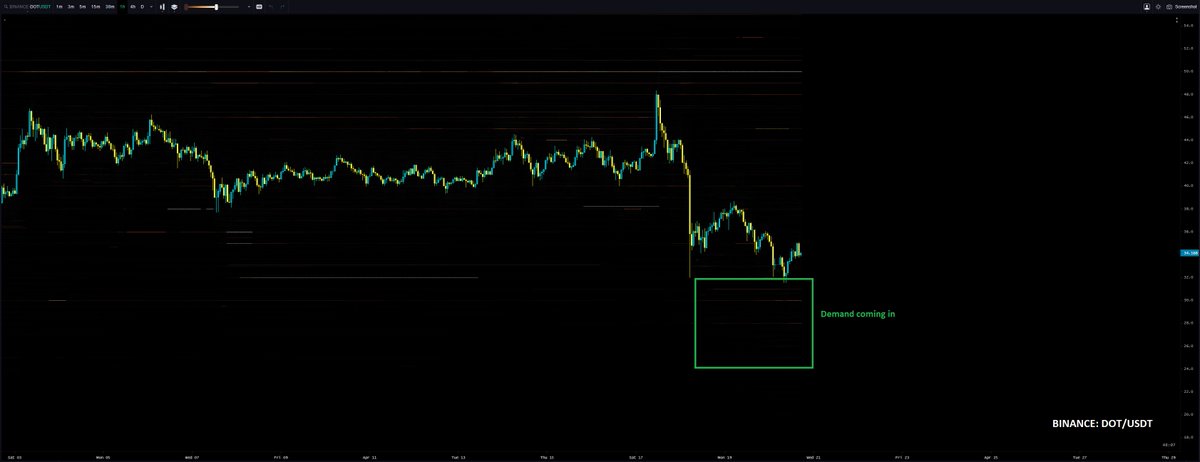
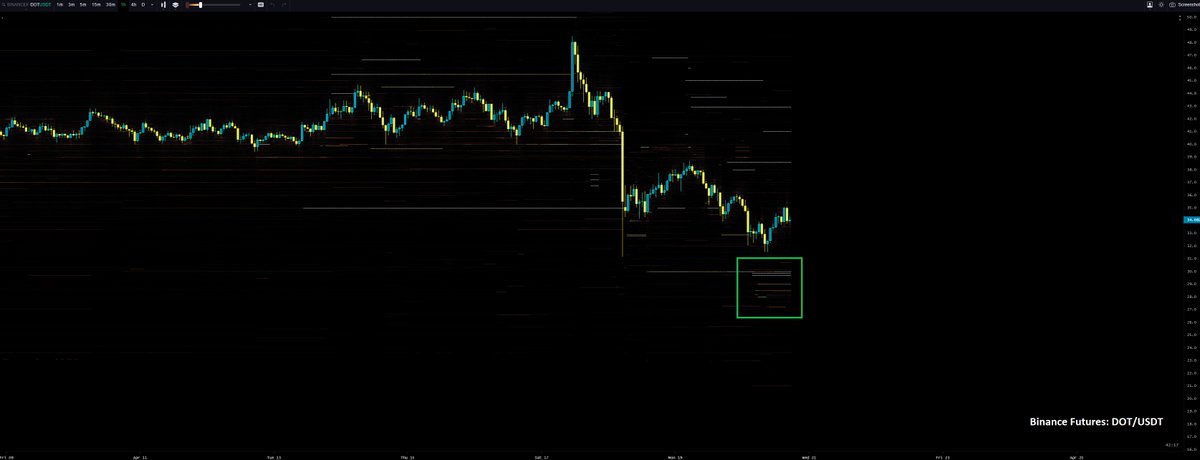
Now let's see some examples of this. I will post charts where the demand is much stronger than supply, and where the result is clear.
One of the clearest examples was after the drop of March 2020. Demand came in strong.
(notes on the charts)
5/n
One of the clearest examples was after the drop of March 2020. Demand came in strong.
(notes on the charts)
5/n
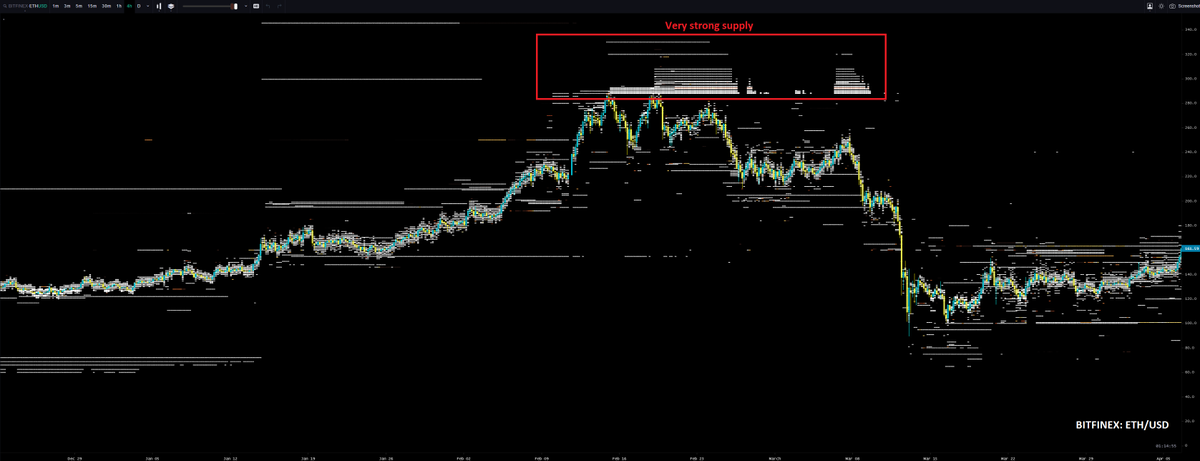
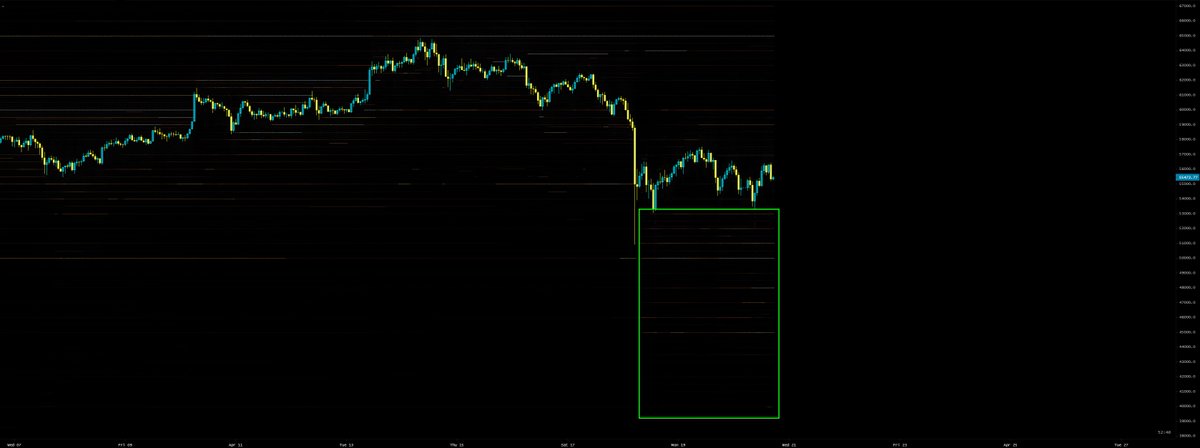
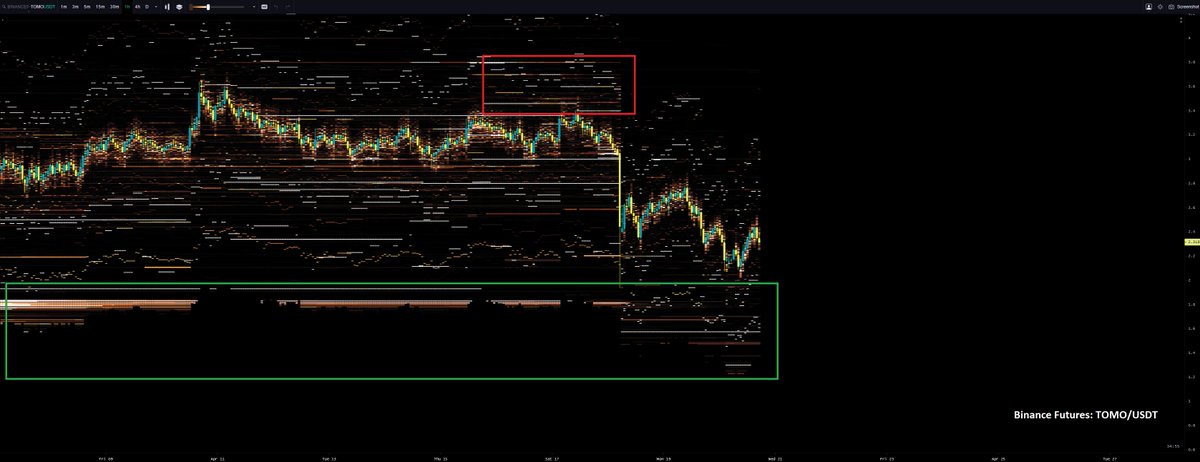
Now I will post charts where supply > demand and the price went down hard after a break in the market structure.
This was clear before the drop of March 2020. Selling pressure was very big.
6/n
This was clear before the drop of March 2020. Selling pressure was very big.
6/n
Why does it work like this? Simple
Imagine that you have limit buy orders at 10k. Price starts going up. What do many people do? They move up those orders, or they just market buy, creating buying pressure.
So we can say that heatmaps have a ''delayed'' effect
7/n
Imagine that you have limit buy orders at 10k. Price starts going up. What do many people do? They move up those orders, or they just market buy, creating buying pressure.
So we can say that heatmaps have a ''delayed'' effect
7/n
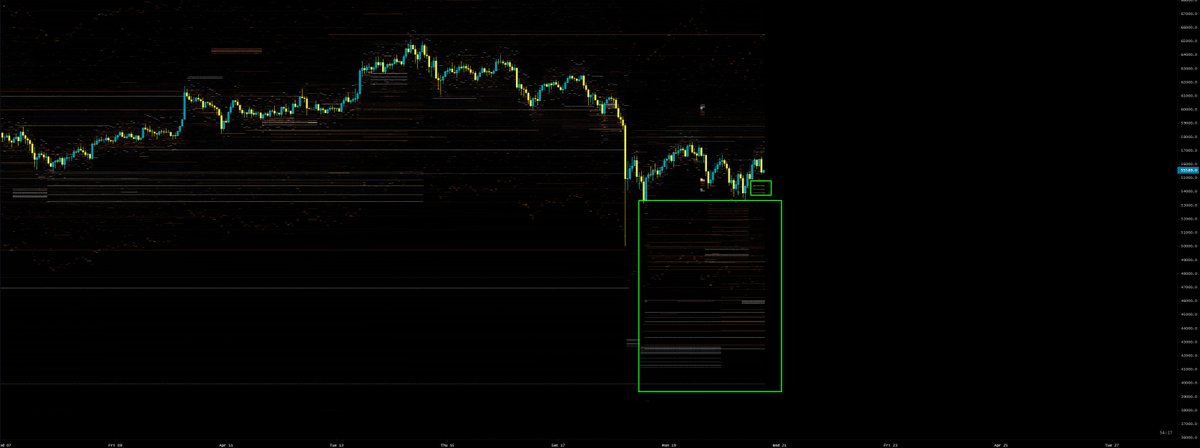
What other trick is used with heatmaps?
Another way to see if one side is showing weakness is to see if those orders become weak or are absorbed, thus knowing that there is more aggressiveness on one side than the other.
Example: chart below
8/n
Another way to see if one side is showing weakness is to see if those orders become weak or are absorbed, thus knowing that there is more aggressiveness on one side than the other.
Example: chart below
8/n
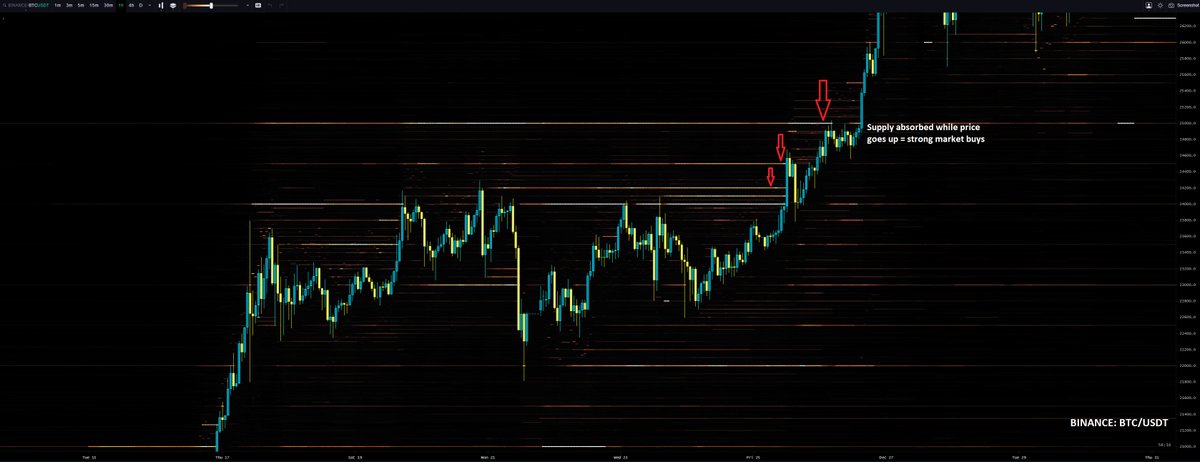
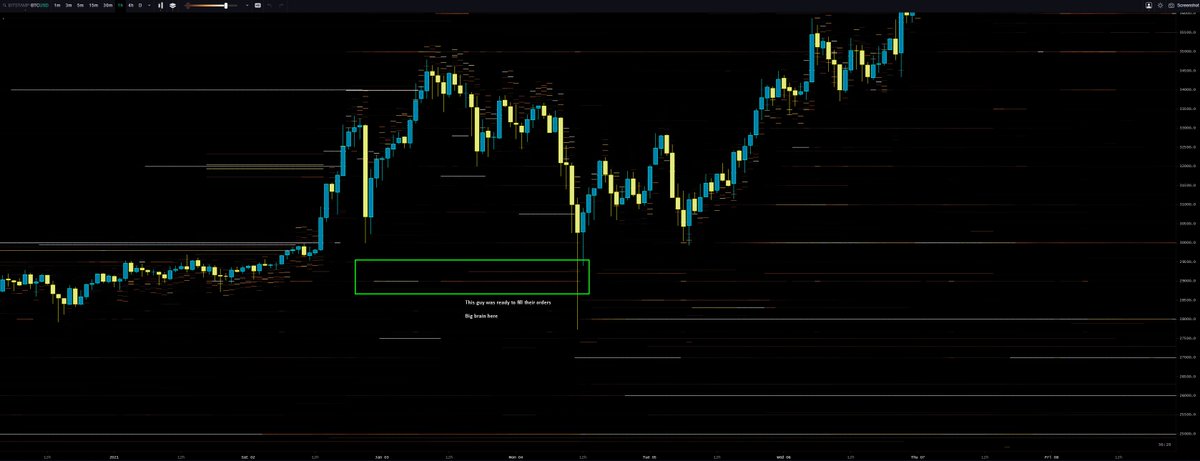
This method requires more practice because it can be misinterpreted. Sometimes orders are absorbed and used as accumulation. This is seen when the price quickly bounces after absorbing a large block.
9/n
9/n
Combining these two heatmap strategies and other ones that I will explain in the near future, you can greatly improve your reading of the market. This added to other methods gives you a pretty good edge.
10/n
10/n
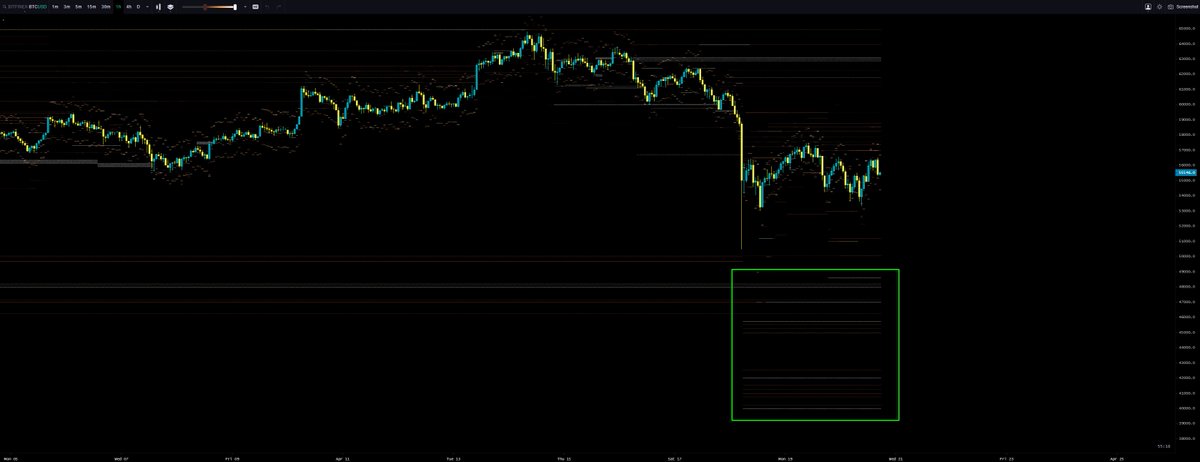
What is the current market situation based on heatmaps?
I have to say it's bullish for #Bitcoin Many exchanges are showing strong demand, while supply is weak.
11/n
I have to say it's bullish for #Bitcoin Many exchanges are showing strong demand, while supply is weak.
11/n
This also happens with the #altcoins, where many of them have very strong demand accompanied by a strong trend, which is usually an even more bullish sign.
12/n
12/n
Some misconceptions:
-A large block doesn't mean that price has to go there.
-A large selling block doesn't mean it will be resistance.
-Heatmaps are very useful but it's better to combine them with other indicators/methods
13/n
-A large block doesn't mean that price has to go there.
-A large selling block doesn't mean it will be resistance.
-Heatmaps are very useful but it's better to combine them with other indicators/methods
13/n
Personally I use @tradinglite. They offer many exchanges to check and many pairs, UI is cool and they also have other useful indicators like funding and OI.
They will include an aggregated heatmap soon.
tradinglite.com
END
They will include an aggregated heatmap soon.
tradinglite.com
END
Loading suggestions...