

Moving Averages Simplified📒
🔵Its a technical indicator used by traders to identify trading opportunities
🔵Its a Lagging indicator
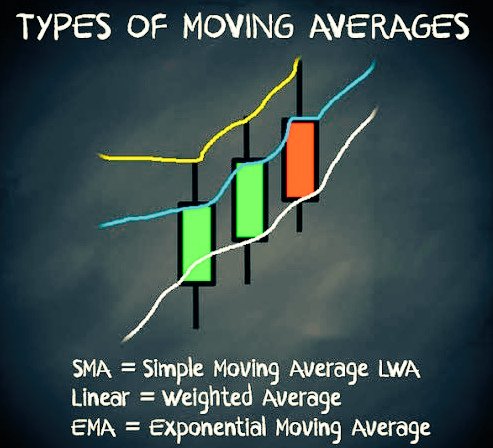
🔵2 MAs which traders use more often are..
SMA(Simple moving average) & EMA(Exponential moving average)
1/n
#StockMarket #Technicals
🔵Its a technical indicator used by traders to identify trading opportunities
🔵Its a Lagging indicator
🔵2 MAs which traders use more often are..
SMA(Simple moving average) & EMA(Exponential moving average)
1/n
#StockMarket #Technicals
Moving Averages Simplified📒
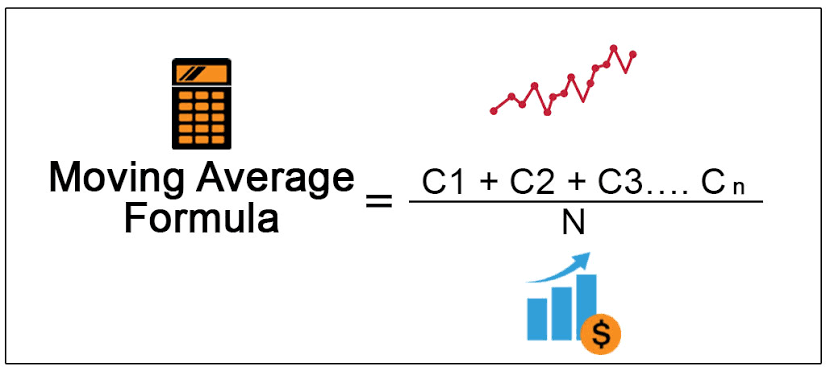
SMA
🔵It is calculated by dividing the averages of closing price for certain period by no. of days in that period
🔵Its helps in assessing the bull or bear trend in the market or a stock
🔵Some commonly used SMAs are 200,100,50,20&10 days
2/n
SMA
🔵It is calculated by dividing the averages of closing price for certain period by no. of days in that period
🔵Its helps in assessing the bull or bear trend in the market or a stock
🔵Some commonly used SMAs are 200,100,50,20&10 days
2/n
Moving Averages Simplified📒
EMA
🔵It places more weightage on recent data
🔵To calculate it we need to calculate smoothing weightage first
🔵For a 20-day moving average, the smoothing weightage would be
2/(20+1)= 0.0952.
🔵It reacts more rapidly in trend chanes vs SMA
3/n
EMA
🔵It places more weightage on recent data
🔵To calculate it we need to calculate smoothing weightage first
🔵For a 20-day moving average, the smoothing weightage would be
2/(20+1)= 0.0952.
🔵It reacts more rapidly in trend chanes vs SMA
3/n

Moving Averages Simplified📒
Crossovers b/w Averages📝
🔵When the shorter moving average crosses above the longer moving average it is called Bullish crossover
🔵when the shorter moving average crosses below the longer moving average it is called Bearish crossover
4/n
Crossovers b/w Averages📝
🔵When the shorter moving average crosses above the longer moving average it is called Bullish crossover
🔵when the shorter moving average crosses below the longer moving average it is called Bearish crossover
4/n

Moving Averages Simplified📒
Applying Crossovers
🔵Golden cross considered as most bullish BO pattern which signals start of a new bull trend the market
🔵Death cross considered as most bearish BO pattern which signals end of a trend
🔵Many traders buy/sell basis Crossovers
5/n
Applying Crossovers
🔵Golden cross considered as most bullish BO pattern which signals start of a new bull trend the market
🔵Death cross considered as most bearish BO pattern which signals end of a trend
🔵Many traders buy/sell basis Crossovers
5/n


Loading suggestions...